Someone brought me a graph with a trend line relating body surface area (BSA) to various cardiac measurements. This graph showed both the trend line and limits at +/-2 standard deviations and +/-3 standard deviations. She asked if I could write a program based on that graph that would allow her to input a patient's BSA and cardiac measures and get a Z-score in return.
My first step was to scan in the image. I tried various resolutions, and it looks like 300 dpi worked reasonably well. Here is a portion of the image that I scanned (reduced to one third the original size to fit easily on this web page).
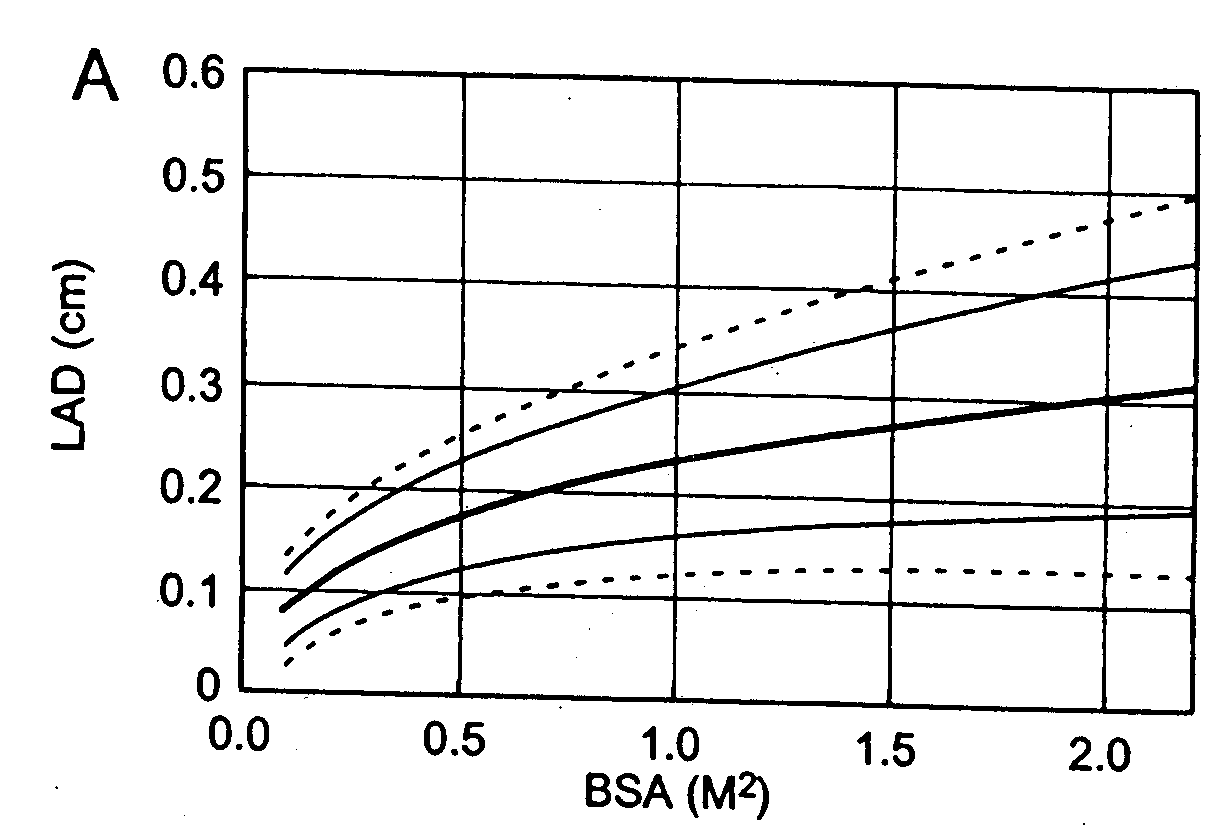
Notice that there is a marked tilt to these graphs.
Then I imported the data into Photoshop Elements. I rotated the graphs by small increments until I got an image where the gridlines appeared roughly vertical and horizontal. Then I noted the physical location of the four corners of each graph (actually, since the right hand side of the graph extends slightly beyond 2.0, I used the co-ordinate 2.0,0.6 instead of the upper right hand corner and 2.0, 0.0 instead of the lower right hand corner.
Then I noted the physical location of a limited number of data points on the trend line itself as well as at +/- 2 SD and +/- 3 SD. You then get three estimates of the trend line (the line itself, a value halfway between the +2 SD and -2 SD lines, and a value halfway between the +3 and -3 SD lines. These values were reasonably consistent, so I averaged them.
The digitized values also provided four estimates of the standard deviation (one-third the difference between the +3 SD line and the trend line, etc.). Again these values were reasonably consistent so I averaged them.
The trend line was well approximated by a quartic polynomial regression model, and the standard deviation was well approximated by a linear regression model. I then programmed the results into a simple Excel spreadsheet.
There is software out there that will do this sort of thing automatically.
- http://www.uniphiz.com/findgraph.htm
- http://www.digitizeit.de/
- http://www.huvard.com/feb/digimatic.html
- http://www.nikhef.nl/~keeshu/datathief/index.html
- http://www.skillcrest.com/
- http://www.acdsystems.com/English/Products/CanvasSI/index?LAN=englishX90
- http://getdata.com.ru/
- http://www.datatrendsoftware.com/
- http://home.xnet.com/~ronjones/#TECHDIG
- http://www.arizona-software.ch/applications/graphclick/en/
- http://www.ezl.com/~ilh2o/tracer.html
- http://www.silkscientific.com/
- http://www.vniief.ru/konv/linetable/linetable_e.html
The prices run from free to hundreds of dollars. Most of the web sites let you download a trial version. You can find a page listing these and additional digitizing resources at
Another interesting product worth mentioning is Cool Ruler. This is a freeware program produced by Fabsoft. It allows you to place a ruler anywhere on your screen and read out units in inches, centimeters, or pixels. You can orient the ruler either horizontally or vertically. I had used Cool Ruler in the past to get approximate sizes of the window in Internet Explorer when it was running in full screen mode on a 640 by 480 pixel monitor. This told me that it would be a bad idea to display any graphic image more than 600 pixels in width.
[Update: May 30, 2006] This graph appears in the following publication:
- Diagnosis, treatment, and long-term management of Kawasaki disease: a statement for health professionals from the Committee on Rheumatic Fever, Endocarditis and Kawasaki Disease, Council on Cardiovascular Disease in the Young, American Heart Association. J. W. Newburger, M. Takahashi, M. A. Gerber, M. H. Gewitz, L. Y. Tani, J. C. Burns, S. T. Shulman, A. F. Bolger, P. Ferrieri, R. S. Baltimore, W. R. Wilson, L. M. Baddour, M. E. Levison, T. J. Pallasch, D. A. Falace, K. A. Taubert. Circulation 2004: 110(17); 2747-71. [Medline] [Abstract] [Full text] [PDF]
and the figure itself is on the web at