News: Sign up for "The Monthly Mean," the newsletter that dares to call itself average, www.pmean.com/news.
| P.Mean: Draft grant submission on patient accrual (created 2011-09-13, last modified 2011-10-19).
News: Sign up for "The Monthly Mean," the newsletter that dares to call itself average, www.pmean.com/news. |
|
Here's an early draft of a grant submission on patient accrual. It is in response to PA-11-180, and we would submit this by February 5, 2012. I have made comments to myself in double brackets.
Before I show you the draft grant, I should note that there are some important unresolved questions about this grant:
Introduction
Researchers overpromise and undeliver on patient accrual, the time frame in which they plan to obtain the proposed sample sizes for their research studies. It is not uncommon for a researcher to promise to get 100 patients within a year, but then struggle to get even a dozen patients after two years. Slow patient accrual leads to delays in completion of the study or sample size shortfalls or both. This creates substantial costs to the researcher but it also raises critical issues for the ethical oversight for these studies by the Institutional Review Board (IRB) and the Data Safety and Monitoring Board (DSMB).
We have developed a formal Bayesian model for accrual. It is a simple model with homogenous accrual: a constant accrual rate across the entire study and exponential waiting times between successive patients. The Bayesian model requires specification of a prior distribution, which forces the researcher to document expectations about accrual. The Bayesian model is updated as patients enter the study to provide a revised forecast of study completion. This allows the IRB or DSMB to objectively assess the progress of a study so that they can demand changes or consider shutting down studies that have no serious prospects of finishing on time with a defensible sample size.
Goal and specific aims
The overall goal of this research grant is to create an environment where researchers can incorporate reasonable accrual plans in their IRB submissions and track accrual progress for reports to the IRB and DSMB. This will provide objective standards that will allow IRB and DSMB reviews to address research delays and allow appropriate interventions to fix or shut down these studies. We wish to promote greater use of accrual planning and monitoring by developing a Java applet for the homogenous accrual model that can be run on a webpage or downloaded to a personal computer. We also wish to examine accrual patterns across a broad range of research studies to look for deviations from the assumption of homogenous accrual. Finally, we want to develop more robust models that can explicitly handle these deviations.
Specific Aim #1: examine delays in accrual and sample size shortfalls in a random audit of IRB approved studies. A random sample of 130 studies approved by the Children's Mercy Hospital IRB and completed in 2001 through 2005 showed serious problems with a failure to document delays in patient accrual and a frequent and large shortfall in sample sizes from those mentioned in the original protocol. We wish to replicate these results at two additional locations. This will help document that slow accrual and the accompanying sample size shortfall is not an isolated problem and will help build the case that careful planning and monitoring of patient accrual is a critical component of ethical review.
Specific Aim #2: develop, test, and deploy a Java applet for homogenous accrual. This program will use an interface similar to the power and sample size applets created by Dr. Russell V. Lenth. It will use the algorithm developed by the authors for a constant accrual rate and an expoential waiting time. It will provide projections of expected sample sizes for a study of fixed duration or projections of expected completion date for a study of fixed sample size. We will pilot test this software with volunteer researchers at [[add details]] and get feedback on the ease of use and applicability of this program. Researchers need an easy and accessible method to plan and monitor accrual. Issues discovered during the testing of this software for the homogenous accrual case will also provide critical input for planning a more comprehensive program that models a wide range of accrual models in heterogenous settings.
Specific Aim #3: examine accrual patterns in real research studies. Our Bayesian accrual assumes homogenous accrual: a constant rate across the entire study and exponential waiting times between patients. We will assess the frequency, magnitude, and types of deviations from homogenous accrual across a broad range of research studies at [[add details]]. We will characterize the nature and pattern of these deviations so that we can extend the current Bayesian model to more complex but also more realistic accrual patterns and distributions.
Specific Aim #4: extend the Bayesian accrual model to heterogenous settings. While the extensions we will look at will depend in part on the results of Aim #2, there are five extensions that we consider likely to be needed. First, we will incorporate a nonconstant accrual rate that allows for a slow startup period as a study gets off the ground. Second, we will incorporate nonconstant accrual rates across different locations in a multi-center trial. Third, we will incorporate a nonconstant accrual rate caused by pulses of volunteers appearing after a series of mailings or other promotions. Fourth, we will extend the Bayesian model to more adaptive and flexible waiting time distributions. Fifth, we will look at an accrual process preceeded by one or more screening/acceptance steps. Extensions to the Bayesian model will allow more realistic plans and more accurate monitoring of accrual patterns.
All of these specific aims will contribute to our long range goal of developing a comprehensive suite of Bayesian models for accrual that will provide an environment where researchers can provide their IRBs with open and transparent documentation of the assumptions they are making about accrual and where IRBs and DSMBs can objectively analyze the progress of accrual and take appropriate action for studies with serious delays.
Research approach
Slow patient accrual is a big problem in research. According to one resource, "more than 80 per cent of clinical trials fail to enrol on time, and this recruitment problem is extremely costly for drug companies, contributing to 85-95 per cent of the lost days in a clinical trial." The problem should be a concern for IRBs. Excessively prolonged completion dates can lead to the reporting of "stale" research results that naively ignore recent changes in the patient population and in alternative treatment options. The sample size shortfall that frequently accompanies slow patient accrual leads to ambguously wide confidence intervals and grossly underpowered test statistics. Thus, slow accrual reduces the benefits of research and can disrupt the careful balance between these benefits and the risks of the research.
DSMBs also need to factor in accrual rates when they are considering whether to stop a study early. There are widely used models for stopping a study because of strong early evidence of efficacy or harm. But if they are considering stopping a study early due to poor prospects of obtaining the necessary patients in a reasonable time frame, most DSMBs rely on informal or subjective criteria.
A small study of proposed nad actual accrual patterns revealed some depressing findings. An IRB at a non-proift hospital opened up its records for review of the proposed time frame and sample size and the actual time frame and sample size. 130 studies completed over a five year time frame were audited, and only 13 had sufficient information in the protocol to allow computation of the planned study duration. This, by itself, is a telling statistic. Researchers did not feel that the proposed study duration is a factor important enough to disclose to the IRB and the IRB was willing to approve studies without this information--effectively signing a blank check.
In two of those 13 studies, there was insufficient information to calculate the actual study duration. In the remaining 11 studies, 8 took longer than proposed and the average increase in study duration across all studies was 65%.
There was also a discrepancy between the planned sample size and the actual sample size. In the 109 studies that had complete and unambiguous documentation of the proposed and actual sample sizes, 59 of them (54%) failed to achieve the proposed sample size and the average shortfall in these studies was 55%.
Although a qualitative analysis of the reasons for delays and sample size shortfalls was planned, none of the final reports even commented on the issue, much less tried to offer any explanation. In our experience, the incomplete reporting and the sample size shortfalls are not a problem unique to this IRB.
In Specific Aim #1, we plan to replicate these results in a random audit of records in two additonal IRBs. We plan to conduct a stratified random sample of 125 studies completed in the years 2006 through 2010 (25 studies per year). Studies will be selected among those submissions requiring full IRB review. Those studies with expedited reviews or those determined to be exempt from review are almost always retrospective studies that would not have an issue with patient accrual.
Among those studies requiring full IRB review, we will exclude any retrospective studies, any studies planning to recruit fewer than 10 patients, or any studies where the sampling unit is something other than an individual patient (e.g, practice-based interventions). For studies that are included in the sample, we plan to collect information from the approved research protocol, any interim reports, and the final report. We will abstract information on the proposed sample size, the actual sample size, the proposed start and end dates, and the actual start and end dates. We will also collect data on the type of research study (sponsored versus unsponsored research, whether a clinical research coordinator is involved and whether this study was part of a multi-center trial and whether a DSMB was appointed to review the progress of the study).
No information that might identify the researcher or the research study will be included in the data abstraction. We will submit the proposed research plan to the IRB for review, though we expect the research to be designated as exempt as the review only involves an audit of reports. There will be no collection of personal health information or interaction with live human subjects.
A sample of 125 studies provides very good precision for estimating the proportion of studies that fail to meet the proposed sample size and the average shortfall in sample size. If the proportion is 0.5 (a worst case scenario) and if 10% of the studies have insufficient information to estimate this proportion, then a 95% confidence interval would have a width of plus/minus 10%. If the ratio of the actual sample size to the proposed sample size has a standard deviation of 50%, then a 95% confidence interval for estimated percentage shortfall would have a width of plus/minus 9%. We would expect to see similar precision on the proportion of studies exceeding the proposed time frame and the average increase in time frame, assuming that this information is tracked across most protocols.
This data will provide evidence that accrual problems are not isolated at a single IRB and would provide motivation for the IRBs being studied to encourage better planning of accrual rates.
In Specific Aim #2, we plan to develop, document, and test a web-based Java applet for the homogenous accrual model. We have developed a Bayesian model for homogenous accrual that was published in the peer-reviewed literature (Gajewski and Simon 2007). We also provided code in R for this model.
Our Bayesian model assumes an exponential waiting time between successive patients. An equivalent model based on a Poisson count of patients recruited per day was developed independently by Anisimov and Federov (2007).
The exponential distribution has a single parameter, theta, that represented that average accrual time and has an equivalent parameterization in terms of lambda, the average accrual rate. We will use the second parameterization.
![]()
We use an inverse gamma distibution as a prior for lambda.

Note that the mean and variation of the inverse gamma distribution are

With the inverse gamma distribution, alpha controls the strength of the prior distribution. The larger the value of alpha, the smaller the standard deviation of the prior distribution. Beta scales the distribution so that it has the proper mean.
The posterior distribution for lambda is also inverse gamma with parameters

where xi represents the individual waiting times and n represents the total sample size. Note that the tightness of the posterior distribution is a function of the tightness of the prior distribution (alpha) and the sample size (n).
The posterior mean is

which you can rewrite as a weighted avareage of the prior mean and the mean of the data.
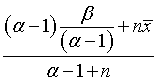
This form of the posterior mean shows the value of a Bayesian approach. If a researcher has a weak prior about accrual, perhaps because this is a novel setting for patient accrual with few historical precedents to provide guidance, then the posterior distribution will be weighted heavily towards the data. A bit of early bad news in this setting will start the alarm early while there is plenty of time for midcourse corrections.
If, in contrast, the researcher has a strong prior about accrual, perhaps because of experience with many similar studies in the same patient setting, then for some time the posterior distribution will be weighted towards the prior distribution. This prevents the researcher from overreacting to some early bad news in a setting where patient accrual is well understood. Even with a strong prior, of course, a sufficient amount of bad news from the actual accrual records will overcome even a strong piror.
The Bayesian approach also allows a smooth transition between relying on initial researcher estimates and relying on the actual accrual information. We have talked to researchers who use initial researcher estimates in the early phase of the study and then switches on an informal and ad hoc basis to a fully data based approach when the actual accrual data becomes sufficiently large. The weighted average avoids this abrupt transition and smoothly models the transition between initial estimates and data-based estimates of accrual.
We believe that a Bayesian approach with informative priors is quite natural for the accrual problem. While the use of informative priors in other settings does come with controversy, here an informative prior makes sense. No researcher would embark on a study if their only knowledge about patient accrual was a vague non-informative prior. The prior distribution actually forces the researcher to produce an estimated accrual rate and to consider the level of certainty about that estimated accrual rate.
Although we have provided R code for the homogenous accrual model, many researchers would find this code difficult to use. We propose, therefore, to revise the homogenous accrual model using a Java applet.
Java offers many advantages. First, it is a portable language that is available for many different software platforms. Second, a Java applet can be run on a website or can be downloaded to your local computer. Third, Java has a rich set of object oriented libraries.
We plan to use an interface similar to the popular and highly regarded Java applets for power and sample size (Lenth 2006). The power and sample size applets have a simple and easy to comprehend user interface (see Figure 1).

Figure 1. Screen shot from power and sample size applet.
The interface uses sliders, which make it easy to explore the impact of changes in the input on the estimated sample size or power. With a mouse click, you can change the sliders to a numeric entry field. The author of the Java applets for power and sample size, Dr. Russell Lenth, has agreed to provide technical oversight on the development of a Java applet for the homogenous accrual Model (JAHAM).
JAHAM will produce estimates of any percentile of the predictive distribution of total study time, assuming a fixed sample size or any percentile of the predictive distribution of the total sample size, assuming a fixed study time. We will also explore the possibility of a graphical display of these predictive distributions.
JAHAM will have sliders for the entry of data to three questions:
Denote the responses to the first two questions as N and T, respectively. Take the answer to the third question and divide by 10. Call this value P. These produce an inverse gamma distribution with parameters alpha=NP and beta=PT. This prior distribution has mean approximately equal to T/N and the standard deviation of the prior distribution goes down as P increases. A choice of P=5 would correspond roughly to a prior distribution with weight equal to half of the proposed sample size.
This is a crude method for producing a prior but it is simple and non-intimidating. One of the great values of JAHAM is that it will show in practical terms what the implications are for a particular prior distribution.
For example, suppose a research team proposes to recruit 350 subjects over a three year period. You ask them how certain they are about this estimate on a scale of 1-10 and they reply "5." This leads to a predictive distribution with a 2.5 and 97.5 percentiles of 2.5 and 3.6 years? This seems a bit narrow so you probe "Do you really think there is only a 2.5% chance that the study will exceed 3.6 years? This can then lead to a different specification, that there is only a 2.5% chance that the study will exceed 5 years, which produces a much more realistic prior distribution.
[[Document who will test the applet and how.]]
In Specific Aim #3, we plan to collect data on actual accrual patterns. We will assess the types of deviations from homogenous accrial, the frequency of these deviations, and the magnitude of these deviations.
We have access to accrual information through [[add details]]. There are multiple projects where researchers have tracked the arrival time of individual patients. This resource is easily anonymized, making ethical approval simple. The accrual information will allow us to identify important questions about the relevance of the homogenous accrual model and will provide direction for extensions of this model.
The first question we wish to examine is whether there is a tendency for clinical trials to have a warm-up period with relatively slow accrual. We also want to examine whether the exponential model (or the equivalent Poisson model) is a reasonable approximation to accrual times.
No model fits perfectly, of course, but we want to examine the magnitude of the deviation of specific accrual data sets from the homogenous accrual model and estimate whether these deviations are likely to produce inaccurate and/or biased assessments of total accrual time.
The data we evaluate in this aim will be very useful in setting priorities for developing extensions to the homogenous accrual model in specific aim #4 and will also provide test data sets for these models.
In Specific Aim #4, we plan to fit heterogenous accrual models using OpenBUGS software. Extensions to the Bayesian model will allow more realistic plans and more accurate monitoring of accrual patterns. Data for these model fits will come from Specific Aim #3 and from simulated accrual patterns.
A homogenous accrual model is a reasonable starting point for and will represent a great improvement in the planning and monitoring of approval. We recognize, however, that accrual patterns in real research studies exhibit a wide range of deviations from heterogenous accrual. In Specific Aim #4, we Although a systematic study of accrual patterns has not been conducted, here are some patterns that we believe are likely to occur.
Figure 2 shows a constant accrual rate. The individual vertical lines represent the times that individual patients enter the study and the diagonal line shows the cumulative accrual of patients over time.

Figure 2. Graph of constant accrual rate.
In contrast, Figure 3 shows a nonconstant accrual rate. In this graph, patients accrue slowly for the first 90 days and more rapidly afterwards.

Figure 3. Graph of nonconstant accrual rate.
There are three attractive alternatives to model slow early accrual. The first is a step function, illustrated in Figure 4.

Figure 4. A step function for modelling slow early accrual rates.
In this model, the accrual rate is 0.11 (one patient on average for every nine days) for the first three months of the trial and 0.33 (one patient on average for every three days) for the remainder of the trial. This model requires the specification of priors on three different parameters:
This model is simple, but the discontinuity may not reflect how accrual changes in practice. An elbow model allows a continuous transition in accrual (Figure 5).

Figure 5. An elbow function for modelling slow early accrual rates.
In the elbow model, the accrual rate starts at 0.11 and rises linearly over 90 days. After 90 days, the accrual rate levels off at 0.33. This model also requires the specification of priors on three different parameters:
Note that a prior on the slope of the linear increase is determined if you specify priors on the three parameters listed. A slightly simpler elbow model starts the accrual rate at zero at the beginning of the study with a linear increase and then a transition to a level accrual rate (Figure 6).

Figure 6. A simpler elbow model.
This elbow model is attractive because it requires specification of priors for two parameters:
It is unclear which model best fits actual accrual rates in the real world, hence the value of obtaining accrual patterns in Specific Aim #3. It is very critical, though, to avoid requesting the specification of too many prior distributions, and it may be worth living with a slightly poorer fit in order to simplify the process of soliciting prior distributions.
Another example of nonhomogenous accrual may occur in a multicenter trial. Different centers have different accrual rates and their staggered entry into the trial will also cause heterogeneity. Figure 7 shows a simulated example of accrual from three centers.

Figure 7. Accrual from a multicenter trial.
We believe that a hierarchical model can fit data well from a multi-center trial. An offset term would be needed to allow the size of a center to enter into the equation. A random center effect in the Bayesian model will allow each center to over-perform or under-perform relative to its size. Entry times for individual centers could be prespecified, or these times could be additional random components of the model.
One big advantage of a hierarchical approach is that the accrual pattern of a late entering center would benefit not only from the prior distribution but also on accumulated accrual information from the centers that are already in the trial. The hierarchical model allows one center to borrow information on accrual patterns from other centers, with the amount of information being borrowed limited by the degree of heterogeneity among centers. This will allow IRBs and DSMBs to receive more precise and accurate prediction of study completion time, enahncing their ability to make critical decisions about modifying or terminating a study.
Another advantage is that a hierarchical model could accomodate mid-study additions of new centers intended to compensate for slow accrual. A DSMB, for example, could examine the projected completion date midways through a twenty center study, but could also get a simulated answer to whether adding four additional centers at this late date would have any impact on the projected completion time.
Another source of heterogeneity may be caused by a variation in the waiting time distribution. The exponential distribution has a "memoryless" property. This means that if you've waited five days after a given patient has arrived and no one new has volunteered yet, the probability that someone will volunteer tomorrow is no different than it was on the day after the last patient had volunteered.
This assumption may not be too unreasonable, though we can examine it with the data collected in specific aim #3. There are some possible alternatives though. The gamma distribution, for example, with the shape parameter less than 1 will represent an accrual pattern of "feast or famine". In this setting, patients arrive in very rapid succession at times with long stretches of no activity in between. Such a pattern is illustrated in Figure 8.

Figure 8. Accrual using a gamma distribution with shape parameter = 0.1.
It is possible that the opposite might occur and that patients appear at more or less regular intervals. This could be modelled by a gamma distribution with shape parameter greater than 1. This might occur if there is a queue of patients waiting at a gate of some kind that retard progress to some extent. In this setting, patients appear more or less like the drips of a faucet, as is illustrated in Figure 9.

Figure 9. Accrual using a gamma distribution with shape parameter = 10.
There are other alternative distributions for waiting times other than the gamma distribution, of course. You can also induce similar patterns of irregularity or excess regularity through a correlational model. The hallmark of most of these alternatives, we suspect will be in how they control the irregularity of patient accrual.
Most clinical trials have one of more screening steps and the loss of patients during the screening will contribute to heterogeneity. Screening could involve a decision by the researcher that a subject who volunteers is ineligible for the trial or it could involve a decision by the volunteer not to participate after the details of the study are explained to him.
An example of losses due to screening appears in Figure 10. The vertical lines represent the appearance of research volunteers, but the red lines represent volunteers who refuse to sign the consent form, who are deemed ineligible by the recruiting physician, or who otherwise do not make it into the trial. Thus the cumulative number of patients jumps up at each black line but stays flat at each red line.

Figure 10. Accrual with an extra screening step.
Losses due to screening are easily modelled using a beta-binomial model and this can be added onto the exponential waiting time. The actual waiting time for patients who make it into the trial will not be exponential, but rather a sum of a random number of exponential random variables reflecting the waiting time extension when a subject fails a screen.
Modeling the screening step provides additional documentation to the IRB about the accrual process. When a research explicitly models uncertainties associated with one or more screening steps, that provides a chance to review whether the researchers assumptions about accrual are reasonable.
[[Document nonconstant accrual rate caused by pulses of volunteers appearing after a series of mailings or other promotions.]]
[[Explain why it is important to model heterogenous accrual.]][[Conclude with how this work will help IRBs and DSMBs.]]
Bibliography
Anisimov VV, Fedorov VV. Modelling, prediction and adaptive adjustment of recruitment in multicentre trials. Statistics in Medicine. 2007;26(27):4958-4975.
Gajewski BJ, Simon SD, Carlson SE. Predicting accrual in clinical trials with Bayesian posterior predictive distributions. Stat Med. 2008 Jun 15;27(13):2328-40.
Lenth, R. V. (2006). Java Applets for Power and Sample Size [Computer software]. Retrieved September 28, 2011, from http://www.stat.uiowa.edu/~rlenth/Power
![]() This page was written by
Steve Simon and is licensed under the
Creative
Commons Attribution 3.0 United States License. Need more
information? I have a page with general help
resources. You can also browse for pages similar to this one at Accrual Problems.
This page was written by
Steve Simon and is licensed under the
Creative
Commons Attribution 3.0 United States License. Need more
information? I have a page with general help
resources. You can also browse for pages similar to this one at Accrual Problems.