News: I'm blogging now. Go to http://blog.pmean.com.
| P.Mean: The coin game (created 2016-10-15).
News: I'm blogging now. Go to http://blog.pmean.com. |
|
The 538 website (http://fivethirtyeight.com) has a series of articles about election polling, sports predictions, and lots of other interesting things that are touched by Statistics. Once a week, they pose a puzzle, and this week's puzzle is quite intriguing.
And now, for Riddler Classic, more coins in this deadly board game puzzle from James Kushner of Sarasota, Florida: While traveling in the Kingdom of Arbitraria, you are accused of a heinous crime. Arbitraria decides who's guilty or innocent not through a court system, but a board game. It's played on a simple board: a track with sequential spaces numbered from 0 to 1,000. The zero space is marked "start," and your token is placed on it. You are handed a fair six-sided die and three coins. You are allowed to place the coins on three different (nonzero) spaces. Once placed, the coins may not be moved. After placing the three coins, you roll the die and move your token forward the appropriate number of spaces. If, after moving the token, it lands on a space with a coin on it, you are freed. If not, you roll again and continue moving forward. If your token passes all three coins without landing on one, you are executed. On which three spaces should you place the coins to maximize your chances of survival? Available at http://fivethirtyeight.com/features/can-you-survive-this-deadly-board-game/
I started out with a simulation in R, but quickly found that you can get a nice exact solution in Microsoft Excel. I'm not a big fan of Excel, but it has the ability to lay out formulas in cells and copy them quickly to other cells that makes it useful. Other spreadsheets will work equally well here.
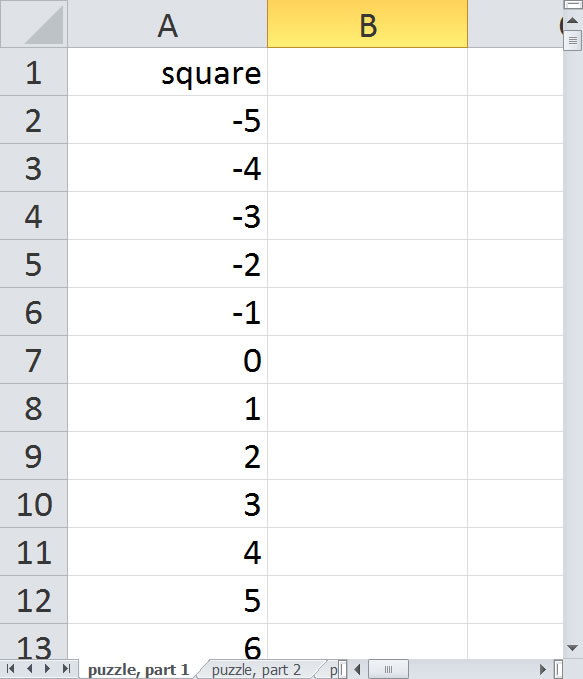
First start out by labeling the square numbers in the first column from 1 to 1,000, but leave room at the top for the start square (0) and for five more squares (-1, -2, -3, -4, and -5).
There is a simple probability relationship. If you land on square X, it happens because either you were on square X-1 on the previous turn and rolled a 1, were on square X-2 and rolled a 2, were on square X-3 and rolled a 3, were on square X-4 and rolled a 4, were on square X-5 and rolled a 5, or were on square X-6 and rolled a 6. So the probability of landing on square X is 1/6 times the probability of landing on X-1 plus 1/6 times the probability X-2, and so forth. Looking at it a bit differently, the probability of landing on X is an average of the probabilities for the previous six squares.
Start with a probability of 1 on square 0 since everyone starts on square 0 and place probabilities of 0 for -1 through -5 since it is impossible to land on those squares.
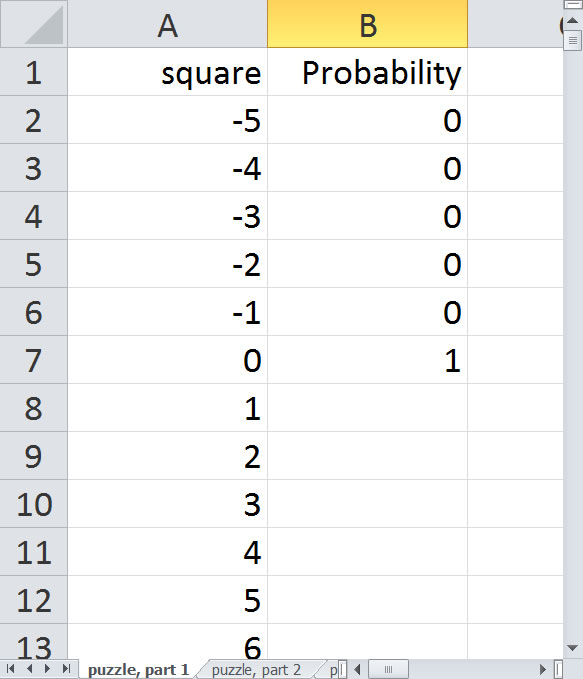
Now the probability of landing on 1 is 1/6, since there is a 1/6 probability of rolling a 1 on your first turn and a 5/6 probability that you will jump past square 1 and never see it again. That is equal to the average of 5 zeros and 1 one.
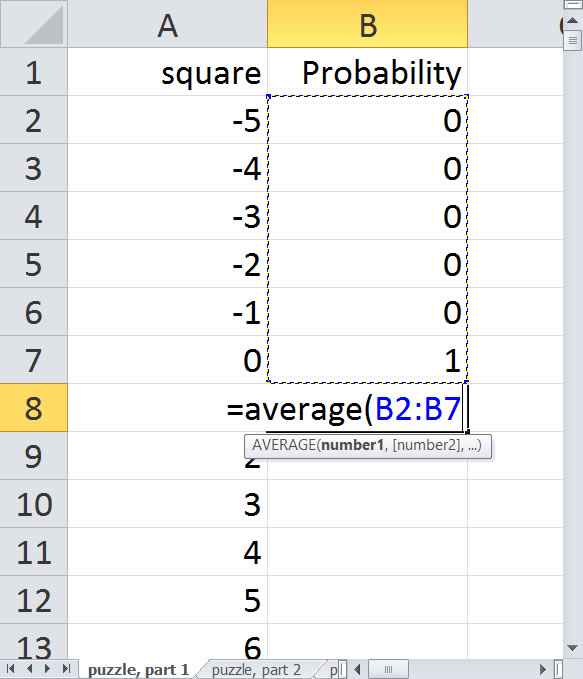
The probability of landing on a 2 is 1/6, if you roll a 2 plus 1/6^2 is you roll two consecutive 1's. That's equal to the average of 1/6, 1, and 4 zeros. You can just drag the formula down from the previous cell, because the formula =average(B2:B7) will be updated to =average(B3:B8). The probability of landing on a 3 is /16 if you roll a 3, plus 1/6^2 if you roll a 1 and a 2, plus 1/6^2 if you roll a 2 and a 1, plus 1/6^3 if you roll three consecutive 1's. If you work out the math, it's the average of 1/6+1/6^2 (the probability on square 2), 1/6 (the probability on square 1), 1 (the probability on square 0), and 3 zeros (the probabilities of squares -1, -2, and -3). So you can drag down the formula again.
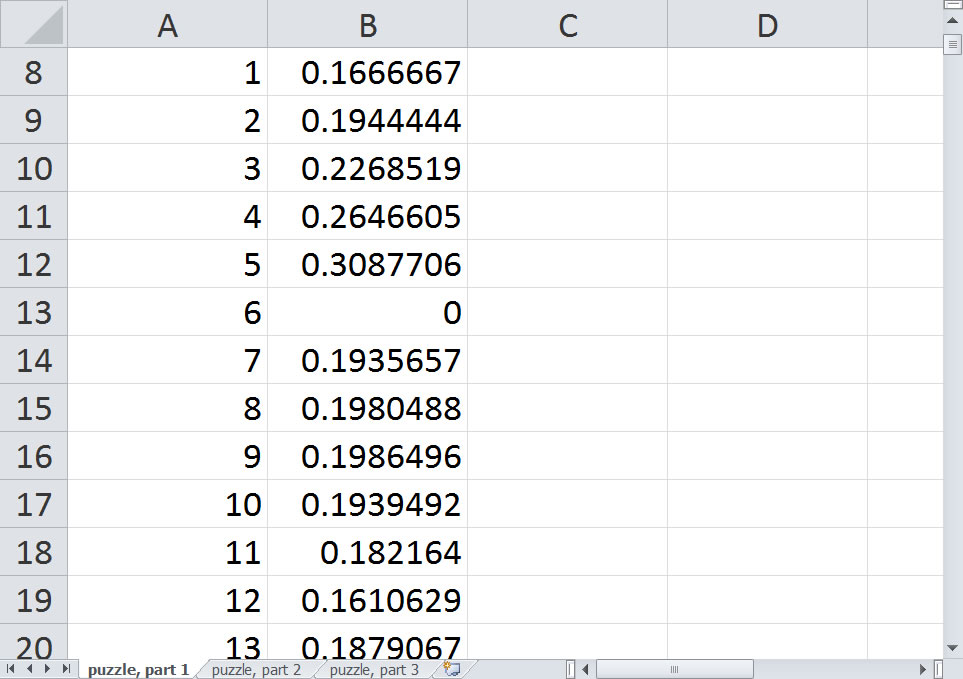
Just keep dragging down until you reach square 1000. Here's what the probabilities look like.
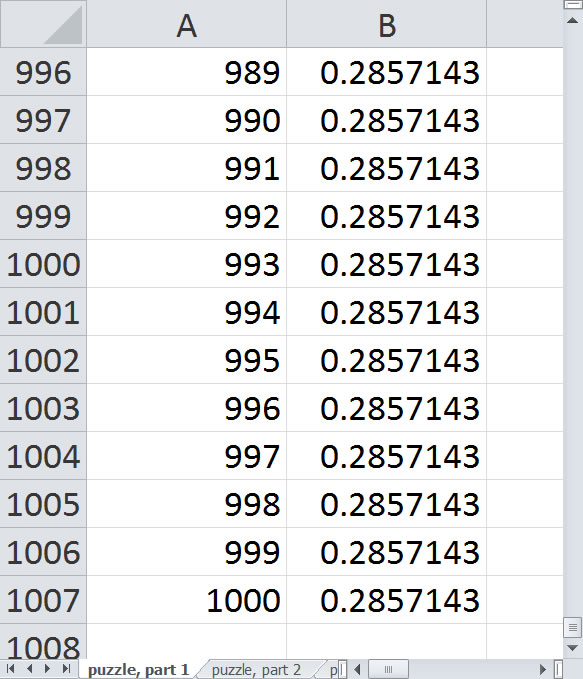
It looks like the probabilities reach a steady state of 2/7. I'll have to think a bit about this but you can probably establish this using theories of Markov processes. The early probabilities are anything but steady state, however.
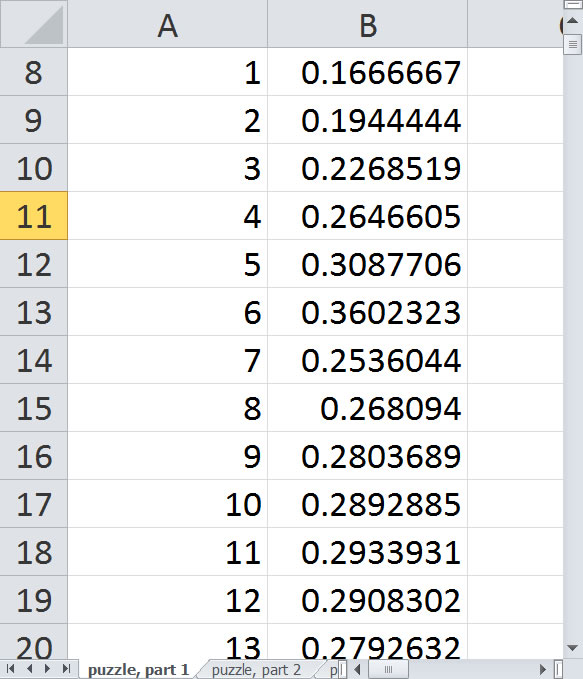
The probabilities increase at first because you are averaging fewer zeros. After square 6, though, the probability drops sharply. Why is this you wonder? All of the squares 1 through 6 involve an average involving the probability of 1 associated with square 0. But square 7 is the first square whose average does not include the 1. This is the first square that you can't reach with a single roll.
It's a bit ironic. A roll of 7 with two dice is the most probable outcome, but landing on a 7 is less probable than landing on a 6, 5, or 4. Or any square larger than 7, for example.
The probabilities rise again a bit then drop slightly at 12 and 13. After that it flattens out again. Here's a plot of the first forty probabilities in R (I refuse to plot in Microsoft Excel).
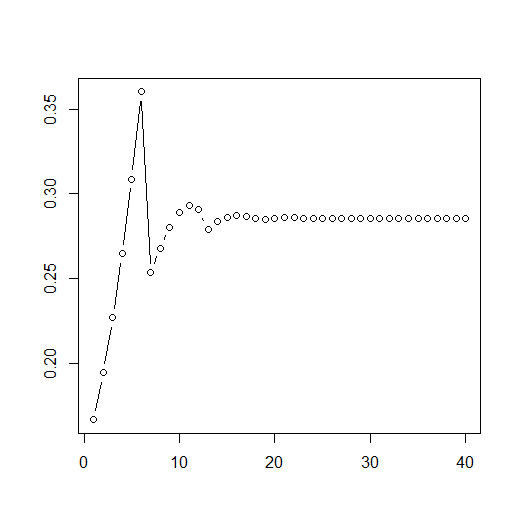
It sort of makes sense that things would smooth out, because the probabilities represent a running average.
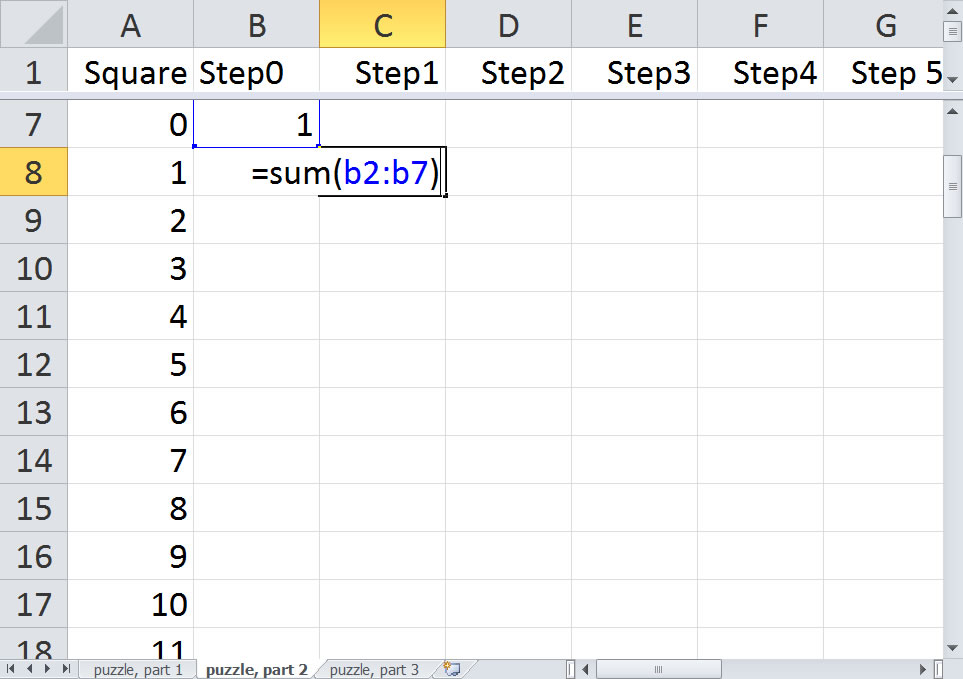
There's another interesting way to look at this. Start with a blank spreadsheet. Number your squares, starting at -5 again. Put labels Step0, Step1, Step2, ... at the top of columns B, C, D, ... Put a single one in the Step0 column and the Square 0 row. Now put the formula =sum(B2:B7) in cell C8, the row corresponding to square 1.
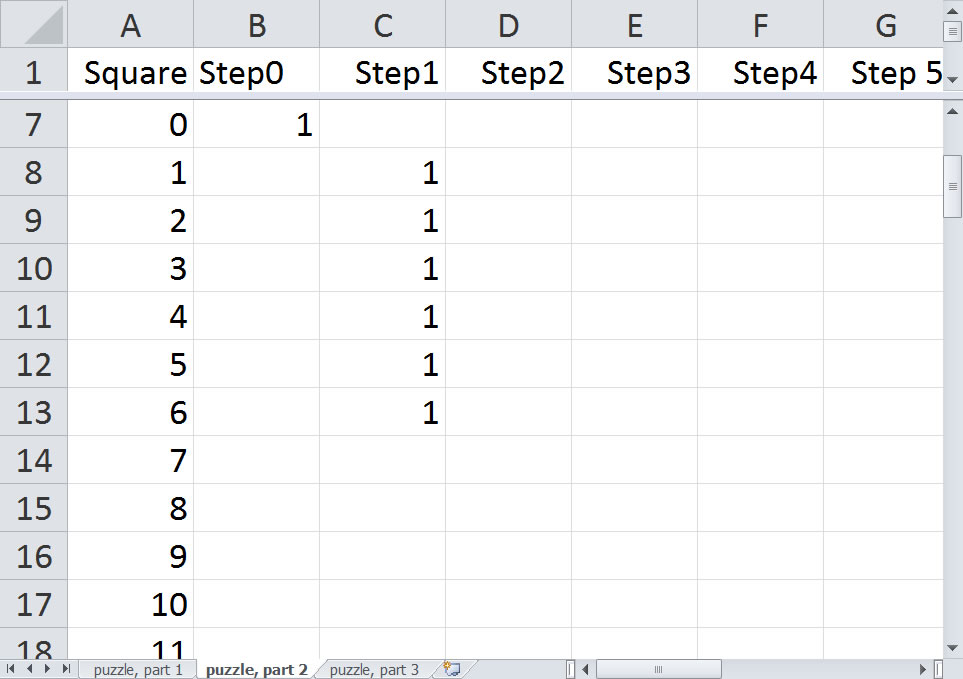
Now copy this down to cell C13, the row corresponding to square 6.
Now copy the formula to cells D9 thrugh D19. This is the Step2 column and the rows corresponding to squares 2 through 12.
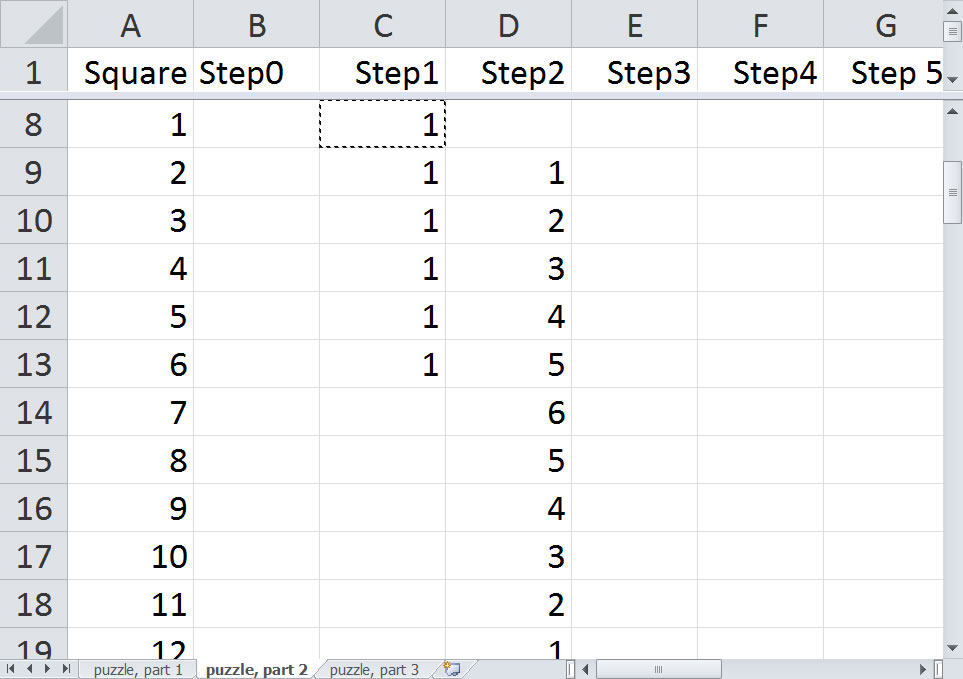
This shows the number of ways that you can get to a square in two steps. You can get to square 9, for example, with rolls of 3,6 or 4,5 or 5,4 or 6,3.
Repeat this copy for squares 3 through 18 in the Step3 column, squares 4 through 24 in the Step4 column, etc.
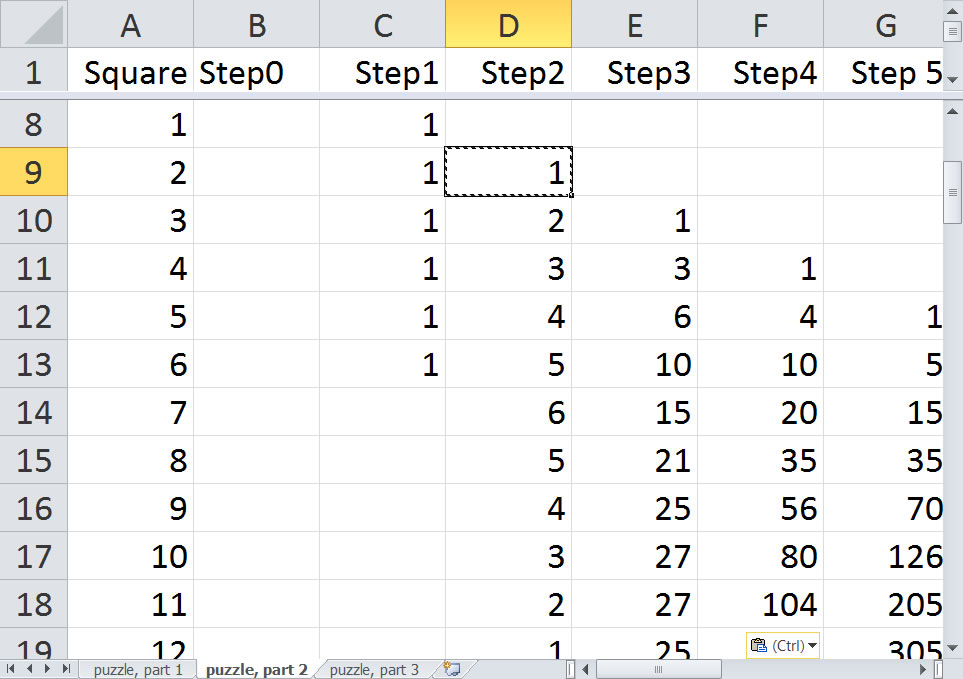
This looks suspiciously like Pascal's triangle. It is not quite because of truncation on the left, but still it represents an interesting pattern. And it tells you, for example, that there are 80 ways to get to square 10 in exactly four steps. If you took the step1 counts and multiplied by 1/6, the step2 counts multiplied by 1/6^2, the step3 counts multiplied by 1/6^3 etc. and added up those values, you would get the same probabilities that you computed earlier with the moving average. Pretty cool, huh?
Now, you're not done. If you had a single coin, you'd be best off placing it on Square 6 where you have a 36% of survival and worst off placing it on Square 1 where you have a 17% chance of survival. But what about three coins?
Well, you could choose the three largest probabilities, corresponding to squares 5, 6, and 11. This would maximize the sum of the individual probabilities. But what you want to maximize is the probability of the union, the probability that you will land on at least one of the three coins. You're not a cat who will save three of your nine lives by landing on all three coins.
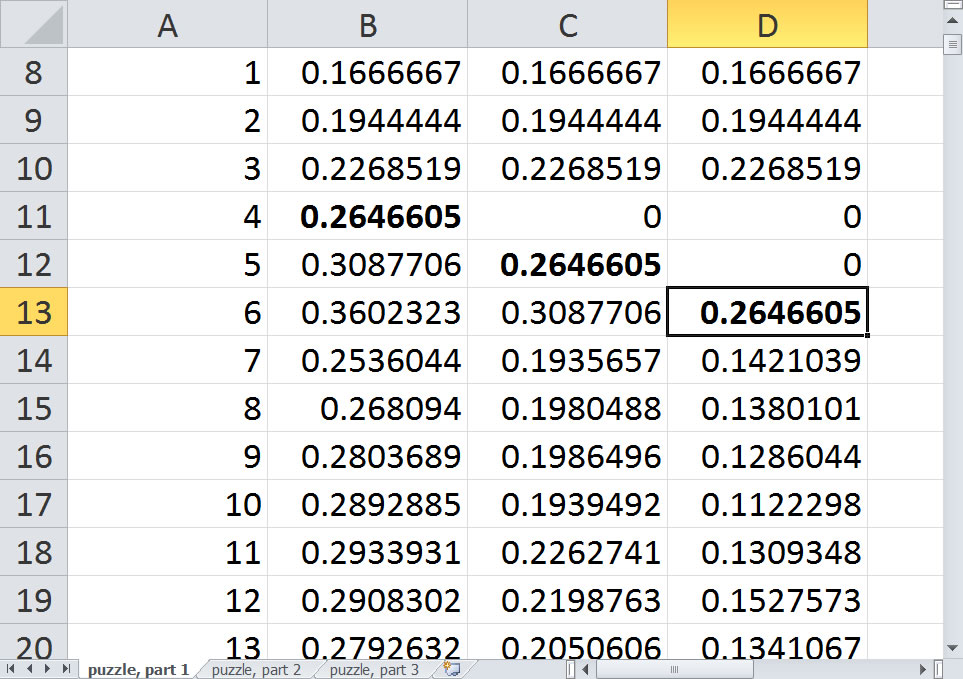
How do you figure out the probability of the union? There are a couple of ways, but the fastest is to add two disjoint probabilities-- the probability of landing on square X plus the probability of landing on square Y given that you did not land on square X. It's easier to work out the probabilities by assuming that X is less than Y.
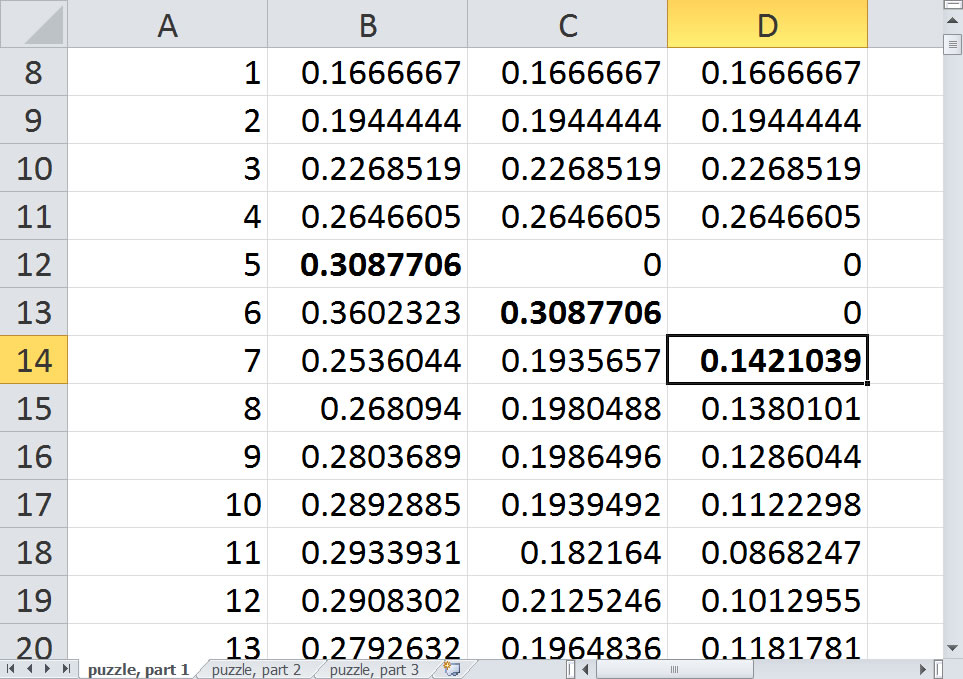
So let's try our most promising case first: The probability of landing on 5 is 31%. What is the probability of landing on 6 given that you didn't land on square 5. That's easy. Just zero out the probability on square 5.
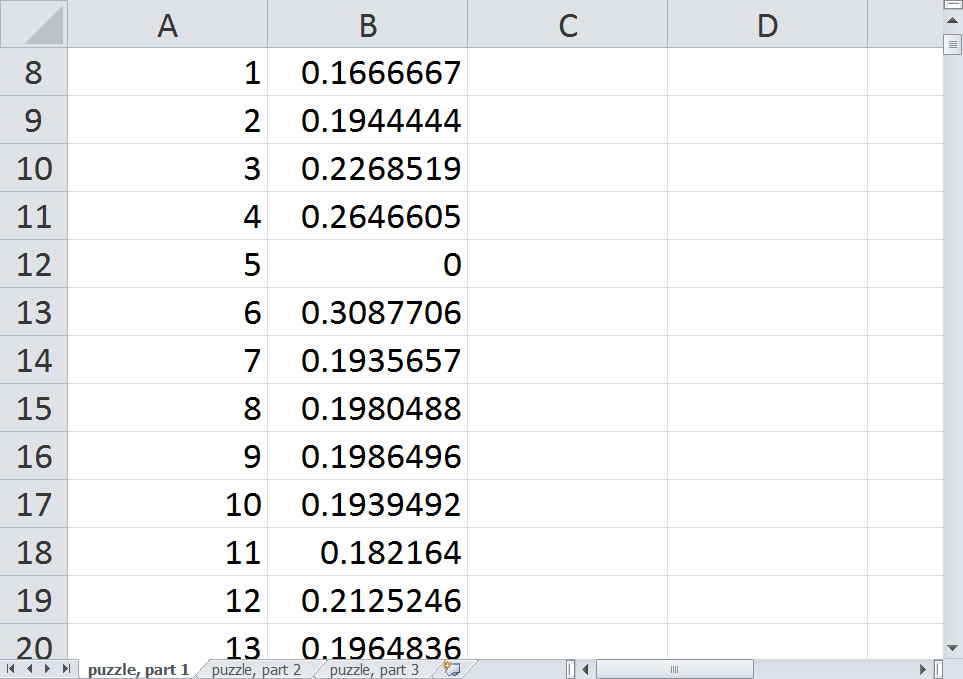
The probability drops from 36% to 31%. In fact, it drops to what the probability on landing on square 5 was. Very interesting.
Now, it looks like the probability of landing on square 5 OR square 6, 62%, is going to be hard to beat, but let's look at some of the squares larger than 7 just to be sure.
It looks like squares 6 and 9 at a probability of 56% represents our best bet, but it still falls short of the 62% with squares 5 and 6.
Repeat this process zeroing out two of the probabilities. Remember to keep the order consistent, zeroing out the smallest square and then zeroing out the second smallest square. It looks like your best bet is squares 4, 5, and 6.
The probability of landing on at least one of these is 79%. Notice that the probability of landing on square 4, the probability of landing on square 5 given that you did not land on square 4, and the probability of landing on square 6 given that you did not land on squares 4 or 5 and all 26%. If you think about it long enough, this should not be too surprising.
Another good combination is 5, 6, and 7, with a probability of 76%.
Now there's a technical issue here. What I used is a "greedy" algorithm. A greedy algorithm tries to maximize a quantity by taking the biggest first bite and then taking the biggest second bite of what remains, and so forth. It's probably fine here, but there are settings where a greedy algorithm does not end up reaching to global maximum and that a strategically placed first bite that is slightly smaller might leave you in a better position for your second and third bites.
There's a lot of interesting stuff that I did not talk about. The probability of the intersection (landing on both squares) involves a convolution of probabilities. And there are some "extra credit" portions of the puzze which I did not solve.
![]() This page was written by
Steve Simon and is licensed under the
Creative
Commons Attribution 3.0 United States License. Need more
information? I have a page with general help
resources. You can also browse for pages similar to this one at Category: Probability concepts.
This page was written by
Steve Simon and is licensed under the
Creative
Commons Attribution 3.0 United States License. Need more
information? I have a page with general help
resources. You can also browse for pages similar to this one at Category: Probability concepts.