[The Monthly Mean] Lessons learned from the Florida results for the U.S. presidential elections in 2000, special election edition--November 2010
The Monthly Mean is a newsletter with articles about Statistics with occasional forays into research ethics and evidence based medicine. I try to keep the articles non-technical, as far as that is possible in Statistics. The newsletter also includes links to interesting articles and websites. There is a very bad joke in every newsletter as well as a bit of personal news about me and my family.
Welcome to the Monthly Mean newsletter. This is a special abbreviated edition for the upcoming U.S. Election and a retrospective on an event ten years ago, that for all its controversy, also served as an excellent teaching example for Statistics. In this special issue, I will discuss some of the statistical concepts associated with the Florida results in the 2000 U.S. presidential election. It is based on a suggestion from one of my readers. I do apologize for sending this out so closely on the heels of an earlier email, as I normally space these newsletters a month (or more) apart. The timing of the current election, though, made me think that an abbreviated special issue might be of interest. If you are having trouble reading this newsletter in your email system, please go to www.pmean.com/news/201011.html. If you are not yet subscribed to this newsletter, you can sign on at www.pmean.com/news. If you no longer wish to receive this newsletter, there is a link to unsubscribe at the bottom of this email.
Here's a list of topics.
1. Exit polling in the 2000 presidential election
2. The butterfly ballot in Palm Beach County
3. Inconsistencies in the manual vote recount
4. The Adams and Fastnow analysis of the Palm Beach County vote
5. Monthly Mean Quote: It's not the voting that's democracy...
6. Upcoming statistics webinars
7. If you like this newsletter, tell your friends
1. Exit polling in the 2000 presidential election
The first issue dealt with exit polling in Florida. The major television networks will "call" a state for a certain candidate. This almost always occurs before all the votes have been tallied. The networks will rely on a variety of information sources to make a call for a particular candidate. Some of this information comes from early returns in key districts in a state that are considered representative of results in that state. Another source of information is exit polling.
In exit polling, people exiting from a voting location are asked who they just voted for. That information can help predict the results of the election, but exit polls also serve other purposes. When combined with a few questions about a voter's demographics and their political beliefs, exit polls can help to explain why the results of an election turned out a particular way (e.g., a large number of women preferred a particular candidate). In some countries, exit polling can serve as an indicator of fraud.
Edison Research, the company that does most of the exit polling in the United States describes exit polling this way:
Exit Polls are interviews with voters after they have cast their votes at their polling places. A sample of precincts is scientifically selected to collectively represent a state, or for the national Exit Poll, the nation. An interviewer gives every nth voter exiting the polling place a questionnaire to complete. There are questions about demographics such as gender, age, race, and issues related to the person's vote choice in different contests. Participation is voluntary and anonymous. The interviewing starts when the polls open and continue throughout the day until about an hour before the polls close. http://www.edisonresearch.com/exit_poll_faq.php
Exit polling is controversial. In some settings the results of exit polling can indicate the probable result of the election before all the polls have closed. This is thought to have led to a decline in voter turnout in the early evening when the results of these polls were released early. Some people might say, why bother voting if the result is already known. In the United States, all the major media outlets have adopted a rule that they will not "call" an election in a state before all the polls in that state have closed.
There are also questions about the accuracy of exit polls. Exit polls are self-reported, and there are some suggestions that in elections involving controversial candidates, some of the people being polled will lie about who they voted for. This problem is compounded by people who refuse to participate in exit polls. The refusal rate varies by important demographic factors, further complicating the issue.
On the evening of the presidential election in 2000, several major media outlets called Florida for Al Gore. Notably, some of these calls occurred before polls in the Florida panhandle (in a different time zone from the rest of Florida), had closed. Later that evening some networks had changed their results and called Florida for George Bush. Then still later in the evening, they retracted that call and classified the state as "too close to call." The repeated changes by the media caused a lot of controversy.
Largely as a result of the exit polling in Florida, media outlets have become more careful about calling election results, but public suspicion still remains.
What's the general statistics lesson here? Polls, by their nature, suffer when people fail to respond or when they respond dishonestly. You can't do anything about this because you can't force people to participate in a poll and you can't tell whether their responses are truthful or not. There are certain aspects about polls that can help reduce the number of people who do not respond. One simple suggestion: save any personal questions (e.g., information about a person's income) until the end of the survey. By the time someone reaches the end, they have built up a sense of understanding about the purpose of this survey and that will engender a level of trust. If you ask the personal questions at the beginning, people will not understand your goals and will be more likely to skip the entire survey. And think long and hard about whether you should even ask personal questions at all. If they are only of peripheral interest, then the biases caused by people refusing to return the survey will outweigh any benefit that you get from asking the question in the first place.
2. The butterfly ballot in Palm Beach County
There was an unusual result of the Florida presidential election in Palm Beach County. The election board in Palm Beach County received complaints before the polls had closed (and before anyone knew about how close the election would be in Florida) from people who thought that they might have voted for the wrong candidate: Patrick Buchanan of the Reform Party instead of Al Gore of the Democratic Party.
When the votes were counted in Palm Beach County, Mr. Buchanan received 3,407 votes, an amount far in excess of any other county in Florida. There is substantial anecdotal and empirical evidence (see below) that thousands of these votes were votes that intended for Al Gore but which were mistakenly cast for Buchanan instead. In addition, there were a large number of "overvotes" in this county. An overvote is when a voter (accidentally or on purpose) votes for two different candidates for the same election. Again, there was evidence that many of these overvotes were cast in error.
What led to the large number of voting errors in Palm Beach County? Many suspect that the layout of the ballot, in a format called the butterfly ballot, led to many of these errors.
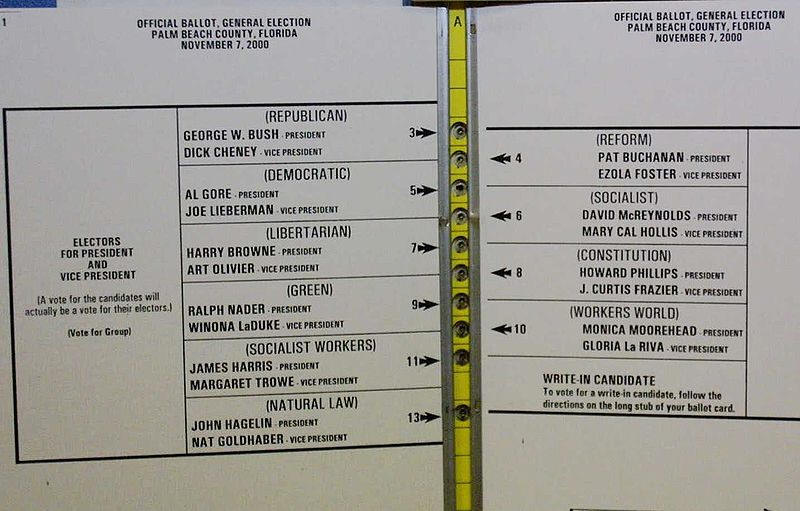
Here is a photograph of the pages of the butterfly ballot on the pages relating to the presidential election, reproduced from the Wikipedia entry on the Florida results in the 2000 presidential election.
Image taken from: http://en.wikipedia.org/wiki/File:Butterfly_large.jpg.
The butterfly ballot lists candidates on alternating sides. The rationale for listing candidates on both sides was that it allowed for larger and more easily read typefaces. The confusion occurred when people accidentally punched out a hole one higher than the candidate's location. The vertical separation between candidates names lined up perfectly with the hole punch for a candidate on the opposite side of the ballot. That leads to a potential mistake for every candidate except the first candidate on the left, where there is no corresponding hole aligned with the upper border that you could mistakenly punch.
Also, the space between the upper and lower border encompasses two hole punches, so some people thought that you had to vote twice, once for the presidential nomination of the party and once for the vice-presidential nomination of the party.
Good explanations of the reasons why the ballot design led to confusion appears at
* http://fury.com/galleries/palmbeach/index.php, and
* http://www.asktog.com/columns/042ButterflyBallot.htmlNow how confusing you think this ballot is depends a lot on whether you are a Republican or a Democrat. And it is worth noting that the electoral official who designed this ballot was a Democrat. So any problems were introduced inadvertently. And a careful voter SHOULD notice the layout and avoid any mistakes.
Still, there is a general statistics lesson here. If you have a new survey, run a pilot test on it before the big study starts. Get people to fill out your survey and comment out loud while they are filling it out. If anything causes confusion, redesign the survey to avoid this confusion. You don't want errant results to dilute the strength of your findings.
3. Inconsistencies in the manual vote recount
The recount that followed the machine tally count was also very controversial. The recount occurred in a limited number of large counties that had already cast a majority of votes for Al Gore. The Democratic party apparently suspected that additional votes would be discovered in those counties and if those extra votes would favor Mr. Gore in the same proportion as the already counted ballots. This led to complaints that recounts weren't also being conducted in counties where George Bush received a majority of votes. Wouldn't extra votes found in those counties split favorably to Mr. Bush?
There was also controversy over deciding what a valid vote would be. The punch mechanism in the card voting machines would not always poke a complete hole in the ballot cards. Sometimes, it would knock out only two corners of the four in the pre-cut rectangular region (a hanging chad). Other times it would leave an indentation (a dimpled chad). Different counties used different standards in deciding if a hanging chad or dimpled chad represented a valid vote.
Image taken from http://commons.wikimedia.org/wiki/File:Looking_for_hanging_chad,_2000_Presidential_election.jpg.
This was one of the issues litigated all the way to the Supreme Court. It was a violation of the equal protection clause of the fourteenth amendment to have a recount that only included some counties or that used standards for counting votes that varied from county to county.
The surprising thing (surprising to me anyway) was that there was not already a uniformly agreed upon standard on what counted as a valid vote. Surely Florida must have had other close elections in the past that required a recount. Weren't standards set for those elections? Apparently not. There was a near total lack of standard operating procedures and operational definitions for how to handle a manual recount of punch card ballots.
There is a general statistics lesson here. If you are counting events in a research study, you need to have a clear definition of what qualifies and what does not qualify as an event. You need to assure that if multiple people are involved in counting events, that those people are using consistent standards.
4. The Adams and Fastnow analysis of the Palm Beach County vote
Shortly after the election, two Harvard political scentists, Greg Adams and Chris Fastnow, prepared a report that estimated the number of votes for Mr. Buchanan in Palm Beach County that were above and beyond what a normal number of votes could be expected. I am recreating that analysis below (with some slight variations) because it illustrates the application of predicted values and residuals in a linear regression model.
Here's a graph of the number of Bush votes versus the number of Buchanan votes in each of the 67 Florida counties.
There is a positive association between the two vote counts because:
a) conservative counties tended to have larger Bush and Buchanan totals, and more importantly,
b) larger counties tended to have greater number of votes for any candidate.Notice the outlier in the middle top of the graph. The is Palm Beach County and you can already see how unusually large the vote count for Mr. Buchanan is.
The regression equation is:
Votes (Buchanan) = 45.3 +0.0049 * Votes (Bush)
Notice that 0.0049 is roughly 1/500. How do we interpret these numbers? The intercept is 45, which means that the estimated average number of votes for Buchanan would be 45 in a county with zero votes for Bush. This is an extrapolation, as every single county in Florida had thousands of votes for Bush. The slope is 1/200, which means that the estimated average number of votes for Buchanan increases by 1/200 for each additional vote for Bush. In other words, each additional 200 votes for Bush is associated with an increase of 1 vote for Buchanan.
We can compute a predicted number of votes for Buchanan for each county by using the above equation. Palm Beach County had 152,846 votes for Bush. So the regression model would predict that Buchanan should get:
45 + 0.0049 * 152,846 = 797.
Thus, if the relationship observed across the entire state held exactly in Palm Beach County, then we would estimate the vote count for Buchanan to be 797.
There were actually 3,407 votes recorded for Buchanan, which is quite a discrepancy from what we predicted. The residual, the difference between what we observed and what would be predicted by the regression model is:
3,407 - 797 = 2,610.
One possible interpretation is that this discrepancy represents an estimate of the number of people who voted incorrectly for Buchanan. Such an interpretation would have to consider other possibilities, though. Is there something unique about Palm Beach County that would cause that county to vote in disproportionate numbers for Buchanan? Buchanan does indeed have some relatives in the area, and although they do not number in the thousands, perhaps they exerted some influence on their community.
Other information might tend to corroborate that a large number of votes were cast erroneously for Buchanan. Some of the highest vote counts for Buchanan were in precincts that were most heavily Democratic. There were also a large number of complaints received by the election board prior to anyone knowing how close the vote count in Florida would be.
There are other models that have been considered for the Palm Beach County vote, and most of them show a similar size discrepancy between the observed vote and the vote that would be predicted the regression model. It would set a dangerous precedent, of course, to use a statistical model to adjust vote counts, so this example is more for understanding what might have gone wrong and the magnitude of the error made.
The general lesson here is that the residual represents the discrepancy between what the actual data value and what a linear regression model predicts. When the residual is large, there is reason to investigate. Please, please, please don't toss out a data value, though, just because it has an extreme residual.
5. Monthly Mean quote: It's not the voting that's democracy; . . .
It's not the voting that's democracy; it's the counting. ~Tom Stoppard, as quoted at http://www.quotegarden.com/election-2000.html.
6. Upcoming statistics webinars
I offer regular webinars (web seminars) for free as a service to the research community and to build up a bit of good will for my independent consulting business. Here are the next two webinars that I have scheduled.
The first three steps in designing a survey, Wednesday, November 17, 11am-noon, CST.
The first thee steps in obtaining ethical approval for your study, Thursday, December 16, 11am-noon, CST.
Both of these webinars represent chapters in an upcoming book that I'm hoping to get published. If you attend this webinar, I'd be very grateful for any comments and suggestions you might have.
To sign up for any of these webinars, send me an email with the date in the title line (e.g., "November 17 webinar"). For further information, go to
* http://www.pmean.com/webinars
7. If you like this newsletter, tell your friends.
I am sending out newsletters on a semi-regular basis because it is fun but also to develop publicity for my independent consulting business. I need more readers to justify the effort that I put in on this newsletter. If you know someone who might be interested in subscribing to The Monthly Mean, forward this message to them. There is a special link at the bottom of this email that can help with forwarding. My goal is to have 1,500 subscribers by the end of the year. I can only do this if you help.
What now?
Sign up for the Monthly Mean newsletter
Review the archive of Monthly Mean newsletters
![]() This work is licensed under a
Creative
Commons Attribution 3.0 United States License. This page was written by
Steve Simon and was last modified on
2017-06-15. Need more
information? I have a page with general help
resources. You can also browse for pages similar to this one at
Category: Website details.
This work is licensed under a
Creative
Commons Attribution 3.0 United States License. This page was written by
Steve Simon and was last modified on
2017-06-15. Need more
information? I have a page with general help
resources. You can also browse for pages similar to this one at
Category: Website details.
