
[The Monthly Mean] May/June 2011--Comparing two rates--not quite the same as comparing two proportions
The Monthly Mean is a newsletter with articles about Statistics with occasional forays into research ethics and evidence based medicine. I try to keep the articles non-technical, as far as that is possible in Statistics. The newsletter also includes links to interesting articles and websites. There is a very bad joke in every newsletter as well as a bit of personal news about me and my family.
Welcome to the Monthly Mean newsletter for May/June 2011. If you are having trouble reading this newsletter in your email system, please go to www.pmean.com/news/201105.html. If you are not yet subscribed to this newsletter, you can sign on at www.pmean.com/news. If you no longer wish to receive this newsletter, there is a link to unsubscribe at the bottom of this email. Here's a list of topics.
Lead article: Comparing two rates--not quite the same as comparing two proportions
How come you have to wait for replication when secondary outcome is statistically significant?
Why McNemar? Why not Chi-square or Fisher's exact?
Monthly Mean Article (peer reviewed): Research During Fellowship: Ten Commandments.
Monthly Mean Article (popular press): When Optimism is Unrealistic
Monthly Mean Book: Mistakes Were Made, But Not by Me: Why We Justify Foolish Beliefs, Bad Decisions, and Hurtful Acts
Monthly Mean Definition: What is the bootstrap?
Monthly Mean Quote: The scientific enterprise is probably...
Monthly Mean Video: Yes Prime Minister Survey
Monthly Mean Website: An Introduction to Wavelets
Nick News: Nicholas gets a new dog
Very bad joke: A Bayesian statistician is...
Tell me what you think.
Join me on Facebook, LinkedIn, and Twitter
Comparing two rates--not quite the same as comparing two proportions.
Rates and proportions are similar quantities in Statistics, but there are important differences in how you calculate a rate versus a proportion and this leads to some subtle differences in how you analyze rate data. Here's a simple example:
"The all-cause mortality rate among 15-59 year olds was 10.2 per 1000 person-years in the pre-ART period (288 deaths/28285 person-years)." Floyd S, Molesworth A, Dube A, et al. Population-Level Reduction in Adult Mortality after Extension of Free Anti-Retroviral Therapy Provision into Rural Areas in Northern Malawi. PLoS ONE. 2010;5(10):e13499. http://dx.doi.org/10.1371/journal.pone.0013499
The value of 10.2 per 1000 person years was computed by dividing the 288 deaths by the 28,285 person years to get 0.0102 deaths per person year and then multiplied by 1000 to get 10.2 death per 1000 person years. This is a rate, not a proportion.
It would have been a proportion if there were 288 deaths among 28,285 persons, but in this example not everyone contributed exactly one year's worth of data. The evaluation period was from August 2002 to June 2005, so many people contributed more than a single patient year. Some people contirbuted less time because they were born in the middle of the evaluation period, or they moved into the region during the evaluation period and they moved out before the evaluation period ended. It seems unfair to treat a person who contributed only a few weeks of data the same as a person who was in the area for the entire evaluation period.
Contrast this with a later statement in the paper.
"Cause of death was un-specifiable for 6% (40/655) of deaths."
In this analysis, all 655 deaths are examined and 40 of those deaths had an unspecified cause.
This is the characteristic difference between a proportion and a rate. A proportion involves a count divided by another count. The numerator of the proportion is always a subset of the denominator. Thus, a proportion can never be greater than 1 (or 100%).
A rate involves a count divided by a measure of time or area. There are different units of measurement for the numerator and denominator, and when you change the units of the denominator, the rate changes proportionately. A rate can be greater than one at times, especially if the units of time or area used in the denominator are very large.
If you dig further into this article, you see that the deaths and person years for ART period 1 and ART period 2 are 158/18514 and 209/30380, respectively.
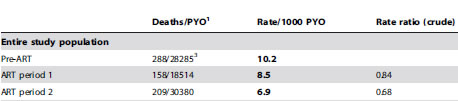
The rates for these two periods, 8.5 and 6.9, are both less than the pre-art period. The rate ratios (RR), 0.84 and 0.68, are literally the ratios of the rates (8.5/10.2 and 6.9/10.2). Both rate ratios are less than one, but how much sampling error could you expect to see in this setting.
There's a good approximate formula for the sample size that states that the natural log of the rate ratio has a standard error that is related to the number of events in the two groups.
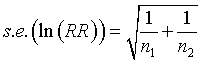
For the rate ratio of 0.84, the natural log is -0.1766. The standard error of this log rate ratio is
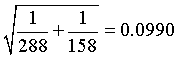
The 95% confidence interval for the log rate ratio is
(-0.1766 - 1.96*0.0990, -0.1766 + 1.96*0.0990) = (-0.3706, 0.0175).
Take the antilog of both limits to get a confidence interval for the rate ratio (rather than for the log rate ratio). This produces a confidence interval that goes from 0.69 to 1.02. Since this confidence interval includes the value of 1.0, you would conclude that the difference in rates from pre-ART to ART period 1 could be due to sampling error. The result is borderline, though, since the interval just barely includes the value of 1.0.
The rate ratio of 0.68, however, is statistically significant because a ratio this extreme is unlikely to occur just from sampling error. Note that the natural logarithm of the rate ratio is
ln(0.68) = -0.3921
and the standard error is
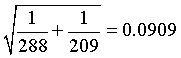
The 95% confidence interval for the log rate ratio is
(-0.3921 - 1.96*0.0909, -0.3921 + 1.96*0.0909) = (-0.5702, -0.2140)
which, when transformed back to the original scale using the antilogarithm, produces 0.57 to 0.81 as the 95% confidence interval for the rate ratio. This interval excludes the value of 1.0, so there is evidence that the death rate is lower in ART period 2 compared to pre-ART.
There are other ways to get confidence intervals for the rate ratio. If you condition on the total number of deaths in the two groups, then the number of deaths in one of the groups follows a binomial distribution and you can use this to derive a confidence interval for the binomial proportion and then transform that proportion into a risk ratio. You can also use Poisson regression. I'll try to show examples of these calculations in future newsletters.
Did you like this article? Visit http://www.pmean.com/category/PoissonRegression.html for related links and pages.
How come you have to wait for replication when secondary outcome is statistically significant?
Someone asked an intriguing question: I have heard off and on that, if a primary outcome is not statistically significant, you should just discount any statistically significant secondary outcomes. I have never been able to find or to conceptualize why this should be so.
When you finish reading a journal article, you are forced to make a choice. Should you go out and immediately change your clinical practice? Or should you say "That's interesting, but I'm going to wait and see if these results are replicated"? Actually, there's a third choice. You can laugh and wonder how such an awful article ever got published. But let's restrict ourselves to the first two options.
When you change your clinical practice to adopt a therapy that is worthless, you (and your patients) end up wasting time, money, and effort on this therapy. This is a false positive finding. The only way to avoid false positive findings is to never change your clinical practice. Are you like this, saying "This is the way I learned it in school 30 years ago, and I don't see any reason to change now"?
When you fail to change your clinical practice to adopt an effective therapy, you and your patients lose out on something good. This is a false negative finding. The only way to avoid false negative findings is to change your clinical practice every time a new result appears. Are you like this, a reed swaying back and forth to whichever way the wind is blowing hardest?
For any rational person, you have to live with the knowledge that you will make false positive and false negative mistakes in your clinical practice. The important thing is to find an acceptable balance.
Here's a scenario proposed by this person: "Consider a study comparing Drug X to placebo for prevention of cardiovascular events in type 1 diabetics. The primary outcome is overall mortality. Let us say that the researchers chose 4 secondary outcomes: death from stroke, stroke, death from MI, and MI. Let us assume that Drug X really works. Let us say that we have non-significant findings for overall mortality, which I realize could be a simple case of lack of power. Let's say that stroke and MI were statistically significant, favoring Drug X over placebo. Is it really true that you believe I should consider these findings tentative? I find it hard to think why that should be."
You are welcome to count secondary outcomes as definitive. No one is stopping you. You are using a more permissive standard than I would, so you'll have fewer false negative results and more false positive results. Is that a problem? Well, it's hard to say.
Here's my perspective. If the researchers knew so little about the drug that they chose the wrong endpoint, that's a huge lack of knowledge of how a drug might work. So that, in itself is a pretty good sign that you need replication. But that's just me. You can draw a different conclusion if you like.
The questioner followed with an interesting comment: The lack of significant mortality outcome could again be a power issue.
You have good company if you note that a stringent requirement like a single primary outcome measure hurts power. Low power means a higher chance of false negative findings. So if you believe that false negative findings are far worse than false positive findings, then by all means please use multiple outcome measures. While you're at it, use a more liberal alpha level like 0.10 or 0.15.
I have a different perspective than you. I believe there are already far too many false positive findings in the research literature. There is empirical evidence to support this (though this research is controversial). I would also argue (and others have made this argument more forcefully and persuasively than I can), that the proliferation of false positives, especially in epidemiological studies, is leading to a lot of cynicism in the general public. And you want to open the floodgates even wider?
Now I am open to a more lenient standard of proof in some settings, especially when you are looking at a treatment for a uniformly fatal condition where there is no current therapy available. But when you are talking about substituting a new therapy for one that already works pretty well, I'm in favor of maintaining a higher standard of proof.
Another point to consider is that the cost of a false negative is not denying patients an effective drug FOREVER. It is the cost of denying them that drug DURING THE TIME IT TAKES FOR A REPLICATION TO BE DONE. In a setting where a somewhat effective therapy already exists, that's not too high a price to pay.
There's a societal cost to this insistence on selecting and acting on the basis of a primary outcome measure. It raises the bar, so that more therapies will require replication before they are adopted by doctors. Again, I would argue that this is not too high a price to pay, though I wish that replicating someone else's research got more respect.
So then the question becomes: if you are only going to adopt a new therapy on the basis of a primary outcome measure, is there any reason to designate secondary outcome measures? It turns out that secondary outcome measures serve several important functions.
First, they help set directions for further research when such research is needed. If you have five secondary outcomes and only two of them are statistically significant, then you know which outcome measures to use (and more importantly which outcome measures not to use) in the next research study.
Second, the secondary outcome measures sometimes help you understand more than just whether a therapy works but why. Imagine a study with all deaths as a primary outcome and secondary outcomes of deaths due to heart failure, deaths due to stroke, and deaths due to all other causes. If you see a significant change in deaths due to stroke but not deaths due to heart failure or all other causes, you understand better how the new therapy helps save lives.
Third, the secondary outcome measures often allow you to assess bias. If you are looking at cases of carbon monoxide (CO) poisoning, you might assess dizziness, headaches, and nausea as primary outcomes, as these are all well known manifestations of this exposure. But you might also designate unrelated symptoms like coughing, joint pain, and skin irritation as secondary outcomes. When you can then show an increase in symptoms associated with CO and show no change in symptoms unassociated with CO, then you have established specificity of your exposure and have some assurance that your CO exposed cohort was not a bunch of whiners who'll complain about anything and everything.
Did you like this article? Visit http://www.pmean.com/category/MultipleComparisons.html for related links and pages.
Why McNemar? Why not Chi-square or Fisher's exact?
Someone asked me about the following scenario, A dermatologist tested a new topical application for the treatment of psoriasis on 48 patients. He applied it to the lesions on one part of the patient's body and what he considered to be the best traditional remedy to the lesions on another but comparable part of the body, the choice of area being made by the toss of a coin. In three patients both areas of psoriasis responded; in 28 patients the disease responded to the traditional remedy but hardly or not at all to the new one; in 13 it responded to the new one but hardly or not at all to the traditional remedy; and in four cases neither remedy caused an appreciable response. I had suggested the use of McNemar's test. The person posing the question wanted to know why the Chi-square or Fisher's Exact test would not be considered.
Here are those numbers arranged in a two by two table.
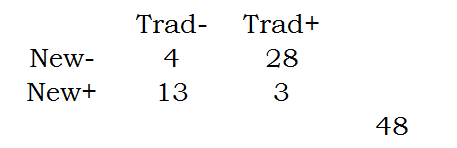
You can compute the row proportions as follows:
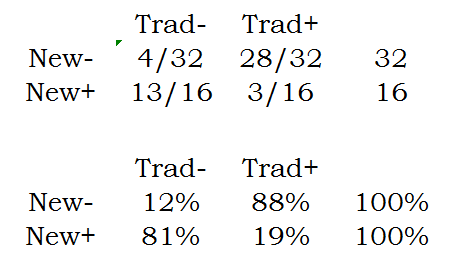
Notice that these proportions add up to 100% within each row.
The column proportions are
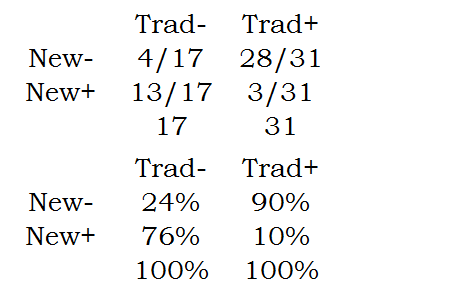
Notice that these proportions add up to 100% within each column.
The marginal proportions are
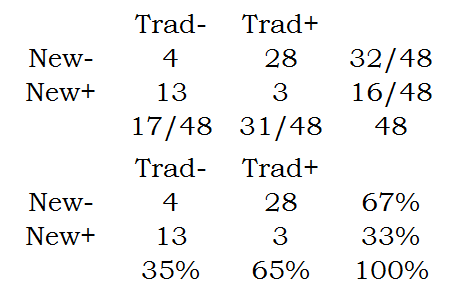
Notice that the marginal proportions are in the margins of the table. The two row margins add up to 100% and the two column margins add up to 100%.
The Chi-square or Fishers Exact test examines equality between two row proportions. It could be the first pair of row proportions (12% versus 81%) or the second pair of row proportions (88% versus 19%). It could even be the column proportions. It turns out that whether you choose the row or column proportions or whether you choose the first pair or the second pair is completely up to you. Choose to make your results more interpretable.
In contrast to the Chi-square or Fishers Exact test, McNemar's test compares the marginal proportions.
Which do you want to use in this example? It turns out the Chi-square and Fishers Exact test provide an answer to an uninteresting question for this data set. Consider the table of column percentages. The second row in this table, 76% and 10% represent the proportion of times that the new test is effective when restricted to those cases where the traditional intervention is ineffective or effective. You can think of the former as those cases so serious that traditional treatments are intractable. The new method does pretty well here, but it doesn't do as well for those cases easily cured by the traditional treatment.
The row percentages tell pretty much the same story and this is hardly a surprise. For patients where the new therapy fails, the traditional therapy does well, but for patients where the new therapy works, traditional therapy does poorly.
While these results are suggestive of the possibility that a combination of treatments might be called for, that is probably not the intention of the researcher. In this design, the marginal probabilities are of more direct interest. The table of marginal probabilities tells you that (28+3) / 48 or 65% of the patients improve with the traditional therapy. In contrast, only (13+3)/48 or 33% of the patients improve with the new therapy. Notice that these two proportions are correlated because they are measured on the same patients.
In general, you should consider McNemar's test when you have paired observations on a binary outcome. It is possible to compute a Chi-square or Fishers Exact test in such a setting but these tests will end up answering the wrong question.
Did you like this article? Visit http://www.pmean.com/category/PoissonRegression.html for related links and pages.
Monthly Mean Article (peer reviewed): Eduardo Mireles-Cabodevila, James K. Stoller. Research During Fellowship: Ten Commandments. Chest. 2009;135(5):1395 -1399. Excerpt: "Doing research is a critical component of an academic training experience for a fellow for at least four reasons, as follows: (1) the experience allows fellows to assess their interest in research and in its conduct as a core component of the career to follow; (2) the experience of doing research provides fellows with the opportunity for mentorship; (3) the research may jumpstart fellows' academic careers by initiating an area of content expertise, and allowing the beginning of a stream of inquiries and publications in that area; and (4) the activities of doing research (eg, formulating hypotheses, presenting the research in various forums, writing grants, and submitting abstracts and [hopefully] manuscripts) offer the fellow practice in honing these skills in a mentored setting. Because doing good research is enhanced by experience, it behooves the fellow to harvest as many lessons (both do's and don'ts) from the training as possible. In this context, this article was written in the hope of both crystallizing and sharing lessons from a pulmonary/critical care fellow's research experience. Though eager to avoid the appearance of hubris in formulating these lessons as 'Ten Commandments,' we submit that framing this experience as commandments may lend the appropriate air of admonition to allow the reader to approach the experience as carefully as possible." [Accessed on May 17, 2011]. Available at: http://chestjournal.chestpubs.org/content/135/5/1395.short
Did you like this article? Visit http://www.pmean.com/category/ResearchDesigns.html for related links and pages.
Monthly Mean Article (popular press): Pauline W. Chen. When Optimism is Unrealistic. The New York Times. 2011. Excerpt: "For almost four decades, researchers and patient advocates have debated the ethics of informed consent in early-phase clinical trials, studies that test only toxicity and dosing and offer little, if any, therapeutic benefit to those enrolled. A major part of the debate has focused on the motivations of patients who participate. Some research on patient motivations has had disturbing ethical implications, indicating that patients may never fully understand the purpose of trials, despite explanations by the researchers. Others have been more reassuring, noting that patients are driven by a sense of altruism and a desire to help others who may one day suffer from the same disease. " [Accessed on May 20, 2011]. http://www.nytimes.com/2011/03/03/health/views/03chen.html.
Did you like this article? Visit http://www.pmean.com/category/EthicsInResearch.html for related links and pages.
Monthly Mean Book:. Mistakes were made, but not by me: Why We Justify Foolish Beliefs, Bad Decisions, and Hurtful Acts, by Carol Tavris and Elliot Aronson. Excerpt from the front flap: "In this terrifically insightful and engaging book, renowned social psychologists Carol Tavris and Elliot Aronson take a compelling look at how the brain is wired for self-justification. When we make mistakes, we must calm the cognitive dissonance that jars our feelings of self-worth. And so we create fictions that absolve us of responsibility, restoring our belief that we are smart, moral, and right--a belief that often keeps us on a course that is dumb, immoral, and wrong."
Did you like this book? Visit http://www.pmean.com/category/CriticalAppraisal.html for related links and pages.
Monthly Mean Definition: What is the bootstrap?
The bootstrap involves repeated re-estimation of a parameter using random samples with replacement from the original data. Because the sampling is with replacement, some items in the data set are selected two or more times and other are not selected at all. When this is repeated a hundred or a thousand times, you get pseudo-samples that behave similarly to the underlying distribution of the data.
The bootstrap is useful when you are worried that the distributional assumptions of a standard statistical approach may not be satisfied. It is also useful when the setting is so complicated that no standard statistical approach is readily available.
You can use these pseudo-samples in several ways. First, you can estimate the mean of these pseudo-samples. They should be close to the estimate itself. If there is a discrepancy, you have a quantitative estimate of bias.
Second, you can look at the standard deviation of these pseudo-samples. This gives you a bootstrap standard error of your estimate.
Third, you can compute the 2.5 percentile and the 97.5 percentile of these pseudo-samples. This gives you a bootstrap confidence interval..
The bootstrap would work like this. Suppose you had a sample of four data points: 1, 3, 5, 9 and you estimated the median from this sample as 4. Now you want to estimate how precise the median of four numbers would be. You repeatedly sample with replacement from the four data points to get the following results:
Median(3,5,1,1)=2
Median(3,9,9,1)=6
Median(5,9,9,9)=9
Median(5,1,9,5)=5
Median(3,9,9,5)=7
Median(1,3,9,5)=4
Median(3,3,9,3)=3
Median(9,5,3,3)=4
Median(1,5,3,1)=2
Median(9,3,3,9)=6
You have a pseudo-sample of 10 re-estimated medians {2, 6, 9, 5, 7, 4, 3, 4, 2, 6}. The behavior of this pseudo-sample mimics the behavior of the median. For example, the standard deviation of these 10 values (2.3) is an estimate of the variability of the median.
This is only 10 bootstrap samples. Normally you would run at least 100, and if you wanted confidence intervals, at least 1000 bootstrap samples.
A quick warning: there are some limitations to the bootstrap when you are using a small sample and when you are estimating certain statistics like the median. I chose this example mostly because it was easy to calculate and show the results.
This gives you a general idea of what the bootstrap can do, but you should consult with a professional statistician before trying to use a bootstrap yourself. There are a lot of subtle variations in how to perform the bootstrap and how to summarize results from your pseudo samples.
Did you like this article? Visit http://www.pmean.com/category/ModelingIssues.html for related links and pages.
Monthly Mean Quote: The scientific enterprise is probably the most fantastic achievement in human history, but that doesn't mean we have a right to overstate what we're accomplishing. —Researcher/physician John Ioannidis, quoted in an Atlantic Monthly profile, “Lies, Damned Lies, and Medical Science” (Nov. 2010).
Monthly Mean Video: Antony Jay and Jonathan Lynn. Yes Prime Minister Survey 2009. An excerpt from the BBC TV show "Yes Prime Minister" wherein Sir Humphrey discusses how to get the survey results you want. [Accessed on May 29, 2011]. http://www.youtube.com/watch?v=3gMcZic1d4U&feature=youtube_gdata_player.
Did you like this video? Visit http://www.pmean.com/category/SurveyDesign.html for related links and pages.
Monthly Mean Website: Amara Lynn Graps. An Introduction to Wavelets Abstract: "Wavelets are mathematical functions that cut up data into different frequency components, and then study each component with a resolution matched to its scale. They have advantages over traditional Fourier methods in analyzing physical situations where the signal contains discontinuities and sharp spikes. Wavelets were developed independently in the fields of mathematics, quantum physics, electrical engineering, and seismic geology. Interchanges between these fields during the last ten years have led to many new wavelet applications such as image compression, turbulence, human vision, radar, and earthquake prediction. This paper introduces wavelets to the interested technical person outside of the digital signal processing field. I describe the history of wavelets beginning with Fourier, compare wavelet transforms with Fourier transforms, state properties and other special aspects of wavelets, and finish with some interesting applications such as image compression, musical tones, and de-noising noisy data. Keywords: Wavelets, Signal Processing Algorithms, Orthogonal Basis Functions, Wavelet Applications." [Accessed on May 12, 2011]. http://www.amara.com/IEEEwave/IEEEwavelet.html.
Did you like this website? Visit http://www.pmean.com/category/ModelingIssues.html for related links and pages.
Nick News: Nicholas gets a new dog. I'm not much of a dog person, but Cathy and Nicholas worked on me. I finally agreed this week that Nicholas could get a dog. We looked at a couple of places, but the Heart of America Humane Society had a very nice dog at the Pet Smart in Overland Park. She's mellow, which is nice but unusual for a dog. We haven't settled on a name yet, but Cinnamon, Sally, and Blaze are all in the running. She's spayed and about six months old. Here's a picture of them lying in the grass.

They look a lot alike so I should point out that Nicholas is the one with the red shirt and Cinnamon is the one with the rabies tag.
Very bad joke: A Bayesian statistician is the only one who can comment on the distribution of another person's posterior without getting slapped. I can't claim credit for this joke, but I also cannot remember where I originally found it.
Tell me what you think. How did you like this newsletter? Give me some feedback by responding to this email. Unlike most newsletters where your reply goes to the bottomless bit bucket, a reply to this newsletter goes back to my main email account. Comment on anything you like but I am especially interested in answers to the following three
questions.
* What was the most important thing that you learned in this newsletter?
* What was the one thing that you found confusing or difficult to follow?
* What other topics would you like to see covered in a future newsletter?
I got one comment from the last news letter offering several suggestions for what SWAG stands for. Nobody else provided feedback to the last newsletter. I'll assume that no news is good news.
Join me on Facebook, LinkedIn, and Twitter. I'm just getting started with social media.
My
Facebook page is
* www.facebook.com/pmean,
my page on LinkedIn is
* www.linkedin.com/in/pmean,
and my Twitter feed name is @profmean.
If you'd like to be a Facebook friend, LinkedIn connection, or tweet follower, I'd love to add you. If you have suggestions on how I could use these social media better, please let me know.
What now?
Sign up for the Monthly Mean newsletter
Review the archive of Monthly Mean newsletters
![]() This work is licensed under a
Creative
Commons Attribution 3.0 United States License. This page was written by
Steve Simon and was last modified on
2017-06-15. Need more
information? I have a page with general help
resources. You can also browse for pages similar to this one at
Category: Website details.
This work is licensed under a
Creative
Commons Attribution 3.0 United States License. This page was written by
Steve Simon and was last modified on
2017-06-15. Need more
information? I have a page with general help
resources. You can also browse for pages similar to this one at
Category: Website details.