
[The Monthly Mean] September-November 2011 -- Why is a 20% dropout rate bad?
You are viewing an early draft of the Monthly Mean newsletter for September-November 2011.
The Monthly Mean is a newsletter with articles about Statistics with occasional forays into research ethics and evidence based medicine. I try to keep the articles non-technical, as far as that is possible in Statistics. The newsletter also includes links to interesting articles and websites. There is a very bad joke in every newsletter as well as a bit of personal news about me and my family.
Welcome to the Monthly Mean newsletter for September-November 2011. I'm sorry this has taken so long to get out. I hope to be back to a more regular schedule in December. If you are having trouble reading this newsletter in your email system, please go to www.pmean.com/news/201111.html. If you are not yet subscribed to this newsletter, you can sign on at www.pmean.com/news. If you no longer wish to receive this newsletter, there is a link to unsubscribe at the bottom of this email. Here's a list of topics.
--> Why is a 20% dropout rate bad?
--> First things first--tell me your research hypothesis
--> Do you want to help me with some research grants?
--> Monthly Mean Article (peer reviewed): How random is the toss of a coin?
--> Monthly Mean Article (popular press): Twitter Study Tracks When We Are :)
--> Monthly Mean Book: The Emperor of All Maladies: A Biography of Cancer
--> Monthly Mean Definition: What is a purposive sample?
--> Monthly Mean Quote: Data is not...
--> Monthly Mean Video: How Juries Are Fooled by Statistics
--> Monthly Mean Website: Equator Network
--> Nick News: Nick takes third in his age group in two 5K races
--> Very bad joke: When you're generating a pointless...
--> Tell me what you think.
--> Join me on Facebook, LinkedIn and Twitter
--> Why is a 20% dropout rate bad? Dear Professor Mean, How can we give an evidence based answer about why 20% loss of follow-up in a randomized trial is too much?
This is a rule of thumb and you need to remember that no one ever got thrown in jail for violating a rule of thumb. There is a mathematical way of examining loss of follow-up rates that may prove useful. Let p represent the proportion of patients who are lost to follow-up. If you just ignored those patients, then you would have the following equation
![]()
where the subscripts "all pts," "completers," and "dropouts" represent the mean response in all patients, patients who completed the study, and patients who dropped out. In a real research study, you would not know the mean for the dropouts, so you would not know how badly the mean of all patients differed from the mean of the completers. Even so, you would often have a subjective assessment on what the mean for the dropouts might be. This can help you get a rough idea of how dangerously you are living. You can rearrange the above equation using basic algebra to get
![]()
![]()
The left hand side looks like the relative error in using the mean of the completers in place of the mean of all patients, but the terms in the numerator are swapped and the denominator needs to be the mean for all patients, not the mean for completers. So you have to do a bit more algebra (which I find a bit tedious to do today), but the bottom line is that the relative error in using the mean of completers in place of the correct mean (the mean of all patients) is roughly proportional to the proportion of dropouts and to the relative difference in the size of the outcome between dropouts and completers.
What does this mean? What does this mean? If both the proportion of dropouts is small and the difference in prognosis between dropouts and completers is small, you are truly worry free. If both are large, you're in big trouble and you know it.
The tricky case is when only one is small. You should be okay as long as the other one isn't horribly bad. So a small dropout rate is okay even with unequal prognosis between completers and dropouts as long as the inequality is not too extreme. Similarly, if the difference in prognosis is small, then any dropout rate that is not terribly bad (less than 30% is what I'd say), should leave you in good shape.
Now it is possible to construct settings where a 10% dropout rate leads to disaster or where you'd be safe even with a 90% dropout rate, but these scenarios are unrealistic. My rule is don't worry about a dropout rate less than 10% except in extraordinary settings. A dropout rate of 30% or higher though, is troublesome unless you have pretty good inside information that the difference in prognosis between dropouts and completers is trivially small.
It would be very difficult to come up with an evidence based justification of this rule of thumb. Such an effort would have to review studies where information on patients who dropped out somehow magically appeared. You could look at studies where dropouts were hunted down and hounded until they revealed what their response would have been, but this is troublesome on both pragmatic and ethical grounds. I doubt that an evidence based answer could ever be obtained. So you'll have to live with an ad hoc rule of thumb. Sorry!
Did you like this article? Visit http://www.pmean.com/category/ExclusionsInResearch.html for related links and pages.
--> First things first--tell me your research hypothesis. I get a lot of questions along the lines of "how much data do I need?" The answer is not always easy, but the first step you need to take if I am going to be able to offer any intelligent advice is for you to define your research hypothesis. Not every study has a research hypothesis, of course, and you should not try to force a research hypothesis on the top of a study where one is not called for. Some studies, for example, attempt to characterize some aspects of a population. In a study of the typical health care expenditures of a patient during their last year of life, you could set up a hypothesis that patients during their last year of life use lots of health care resources. But this would be rather silly. Others try to establish the validity and reliability of a health measurement scale. In these studies, you could say that the research hypothesis is that your health measurement scale is valid and reliable. I don't think this is of much use.
For those studies where it is appropriate, specifying that hypothesis makes my job a lot easier. A research hypothesis typically (not always) has four elements designatied by the letters PICO: a patient group (P), an intervention (I), a control or comparison group (C), and an outcome measure (O). Sometimes the patient group is defined by the intervention. Sometimes you have an exposure rather than an intervention, and sometimes there is more than one intervention in the study. But the four elements defined by PICO represent a good starting point for defining a research hypothesis.
The first thing I typically look at in the research hypothesis is the form of the outcome variable. If the outcome variable is continuous, then you will probably need some type of test involving the means (or possibly the medians) of that outcome variable. If the outcome is categorical, then you might want some type of test involving proportions. If the outcome is time to an event, then you usually want some type of survival curve model. If the outcome is a count, then you might possibly want some type of test involving rates. The sample size is then determined by assuring reasonable power for the statistical test that is appropriate for your research hypothesis.
For studies that do not have a research hypothesis, I usually look for some statistical quantity that needs to be calculated as part of the research. In a validity or reliability study, this is often a correlation of some sort. In a study of a diagnostic test, the sensitivity or specificity is often important. Then I select a sample size to insure that the confidence interval around that statistical quantity is reasonably precise.
How much data do you need for a qualitative study? When the goals of a study are qualitative, the sample size justification is also qualitative. Sampling typically ends in a qualitative study when saturation occurs. Saturation is when you start hearing the same themes over and over again and no new themes are emerging. Such a soft criteria for ending your study makes planning difficult. Even worse, the sampling strategy is often modified as the qualitative summaries of the early results are tabulated. You might change the size, location, and composition of your focus groups for example, to try to explore more efficiently some of the provisional findings from the earlier focus groups. In a study of nursing work environment, for example, there was a large, vocal, and unexpected commentary about generational differences between nurses. This led to formation of new focus groups with only Baby Boomer nurses and only Generation X nurses.
Now modification of the sampling strategy is all well and good, but you still have to budget your data collection costs up front. Just saying "we'll wing it" is not going to work. You may have to rely on sample sizes used for similar studies. The relative homogeneity of patients being recruited for your qualitative research is also critical. If your patients are highly heterogenous (coming from a highly diverse population and/or offering a broad range of different perspectives), then you will probably need a much larger sample size.
So start with a sample size from a similar study and adjust if upward/downward if you think heterogeneity is a bigger/smaller problem in your particular setting. Then state that you will sample until you reach your target number of patients or until you reach saturation, whichever comes first.
Did you like this article? Visit http://www.pmean.com/category/SampleSizeJustification.html for related links and pages.
--> Do you want to me with some research grants? I am currently writing up two research grants and I thought some of you might be able to help me. There might be something in it for you as well. The first grant is looking at accrual patterns in clinical trials and the second is a pilot study surveying the use of risk adjustment methods in the peer-reviewed literature.
Accrual is the speed at which you recruit patients into your clinical trial. Slow accrual, which happens far too often, means delays in the completion of the research and possibly completion of the research with a sample size far smaller than what you originally planned for. With a colleague, Byron Gajewski, I have developed some Bayesian models for accrual. The Bayesian approach is ideal for planning because it requires the specification of a prior distribution on accrual times. The prior distribution forces you to confront what you know and don't know about accrual in this patient population. As you observe data on accrual during the trial, you can compute an updated predictive distribution for the completion time of the trial (for a fixed sample size) or an updated predictive distribution for the final sample size of the trial (for a fixed completion date). This predictive distribution provides an early warning when your trial is getting ready to jump the shark.
We want to extend the Bayesian model to more complex cases and we need help in several areas. First, we'd like to work with some ethical review committees (e.g., Institutional Review Boards, Data Safety and Monitoring Committees) to see how much of a problem this is. Second, we'd like to obtain accrual data from some completed clinical trials. Third, we'd like any comments you can offer to improve the quality of our writing for this grant. A preliminary draft of this grant is available at
-->http://www.pmean.com/11/DraftGrant.html
but I also have an updated version that I can share with anyone who might be interested. This grant is due on February 5, 2012.
The pilot study is looking at the methods of risk adjustment that are reported in the peer-reviewed literature. I want to get a convenience sample of peer-reviewed literature in three difference medical specialties and across a broad time frame. Several experts would get paid a nominal amount (maybe $20 per paper) to abstract information about whether risk adjustment was done, what method was employed (e.g., weighting, matching, covariate adjustment), and whether the risk adjustment was appropriate. The search strategy used to obtain this convenience sample and an improved method for abstracting information would be submitted for a larger grant, possibly to NIH.
I need help in several areas. First, I need to identify experts in literature searching who could help find articles in the peer-reviewed literature that meet my criteria and to suggest improvements to the search methods for a larger study. Second, I need to identify experts in quantitative methods (e.g., statisticians, epidemiologists) who would be willing to read a large number of papers and abstract information about risk adjustment methods in those papers. Third, I'd like any comments you can offer to improve the quality of our writing for this grant. A preliminary draft of this grant is available at
-->http://www.pmean.com/11/PilotGrant.html
This grant is due on January 9, 2012.
I have lots more information on both grants that I can share if you are curious.
Send me an email if you can help on either of these grants or if you want more information.
Did you like this article? Visit http://www.pmean.com/category/AccrualProblems.html and http://www.pmean.com/category/ModelingIssues.html for related links and pages.
-->Monthly Mean Article (peer reviewed): Matthew P.A. Clark, Brian D. Westerberg. How random is the toss of a coin? Canadian Medical Association Journal. 2009;181(12):E306 -E308. Abstract: "Background: The toss of a coin has been a method used to determine random outcomes for centuries. It is still used in some research studies as a method of randomization, although it has largely been discredited as a valid randomization method. We sought to provide evidence that the toss of a coin can be manipulated. Methods: We performed a prospective experiment involving otolaryngology residents in Vancouver, Canada. The main outcome was the proportion of 'heads' coin tosses achieved (out of 300 attempts) by each participant. Each of the participants attempted to flip the coin so as to achieve a heads result. Results: All participants achieved more heads than tails results, with 7 of the 13 participants having significantly more heads results (p < 0.05). The highest proportion of heads achieved was 0.68 (95% confidence interval 0.62 - 0.73, p < 0.001). Interpretation: Certain people are able to successfully manipulate the toss of a coin. This throws into doubt the validity of using a coin toss to determine a chance result." [Accessed on November 14, 2011]. Available at http://www.cmaj.ca/content/181/12/E306.long
Did you like this article? Visit http://www.pmean.com/category/RandomizationInResearch.html for related links and pages.
-->Monthly Mean Article (popular press): Benedict Carey. Twitter Study Tracks When We Are :) The New York Times, September 29, 2011. Excerpt: "However grumpy people are when they wake up, and whether they stumble to their feet in Madrid, Mexico City or Minnetonka, Minn., they tend to brighten by breakfast time and feel their moods taper gradually to a low in the late afternoon, before rallying again near bedtime, a large-scale study of posts on the social media site Twitter found." Note that is is an example of a relatively new area of Statistics, text analysis. Available at http://www.nytimes.com/2011/09/30/science/30twitter.html
Did you like this article? Visit http://www.pmean.com/category/QualitativeResearch.html for related links and pages.
-->Monthly Mean Book: Siddhartha Mukherjee. The Emperor of All Maladies: A Biography of Cancer. Description: The history of cancer is tightly intertwined with the history of Statistics and almost all of the advances in cancer treatment would have been impossible without parallel advances in Statistics. This book documents the importance of surrogate outcomes in the early studies of leukemia patients and the surprisingly disappointing population based studies that showed almost no progress in life expectancy improvements after decades of "the war against cancer."
Did you like this book? Visit http://www.pmean.com/category/HumanSideStatistics.html for related links and pages.
-->Monthly Mean Definition: What is a purposive sample? A purposive sample (sometimes called a purposeful sample) is a sample selected in a deliberative and non-random fashion to achieve a certain goal. In a focus group, for example, you may want to consciously seek out respondents at both ends of a spectrum (as well as some in the middle) to insure that all viewpoints are adequately represented. You might also preferentially recruit subjects who have the best knowledge and experience in an area. In addition to focus group studies, purposive samples are often used in pilot studies. Here are two examples of purposive samples.
A study of rehabilitation after stroke collected a small sample for a focus group of patients, care givers, and health care providers with unique expertise. In order to achieve experimental diversification, participants were identified by purposive selection. The patients (n = 4) and the caregivers (n = 5) were recruited through social workers from the local community service centers, daycare centers and also chosen from a data bank of participants to previous studies. Health care providers (n = 9) were solicited through directors of professional services and coordinators of rehabilitation or home-based services. They worked in different fields of healthcare and services, in rural and urban areas. Administrators (n = 7) were recruited through hospital managers who would identify which one was more familiar with the study clientele and worked in various rural and urban areas. All participants were recruited because of their critical abilities and their experience with needs related to the stroke process from onset to reintegration into the community. Talbot LR, Viscogliosi C, Desrosiers J, Vincent C, Rousseau J, Robichaud L. Identification of rehabilitation needs after a stroke: an exploratory study. Health Qual Life Outcomes 2004: 2(1); 53. Available at http://www.hqlo.com/content/2/1/53
The findings represent the views of 169 people with characteristics as presented in Table 1. The participants tended to be older since participants were purposively chosen for experience with the system and for characteristics (drug-dependence, homelessness) that develop over time. Teenagers were not excluded. Milligan R, Wingrove BK, Richards L, Rodan M, Monroe-Lord L, Jackson V, Hatcher B, Harris C, Henderson C, Johnson AA. Perceptions about prenatal care: views of urban vulnerable groups. BMC Public Health 2002: 2(1); 25. Available at http://www.biomedcentral.com/1471-2458/2/25
A purposive sample shares the same weaknesses as a convenience sample and you will have difficulty making strong quantitative inferences from such a sample. The advantage of the puposive sample is that you can rapidly get the types of patients that you really need.
An earlier version of this definition was published at my old website:
--> http://www.childrensmercy.org/stats/definitions/purposive.htm
Did you like this article? Visit http://www.pmean.com/category/ResearchDesigns.html for related links and pages.
-->Monthly Mean Quote: Data is not information, information is not knowledge, knowledge is not understanding, understanding is not wisdom." Clifford Stoll as quoted at http://winnews.com/2011/09/16/watch-your-windows-7-media-on-your-new-tv/
-->Monthly Mean Video: Peter Donnely. How Juries are Fooled by Statistics. Excerpt: "Oxford mathematician Peter Donnelly reveals the common mistakes humans make in interpreting statistics -- and the devastating impact these errors can have on the outcome of criminal trials." Available at http://www.youtube.com/watch?v=kLmzxmRcUTo
Did you like this video? Visit http://www.pmean.com/category/HumanSideStatistics.html for related links and pages.
-->Monthly Mean Website: Doug Altman, John Hoey, Ana Marusic, David Moher, Kenneth F. Schulz, Iveta Simera, Allison Hirst, Shona Kirtley, Tracy Edwards. Equator Network. Excerpt: "Welcome to the EQUATOR Network website - the resource centre for good reporting of health research studies . Too often, good research evidence is undermined by poor quality reporting. The EQUATOR Network is an international initiative that seeks to improve reliability and value of medical research literature by promoting transparent and accurate reporting of research studies." [Accessed on November 26, 2011]. http://www.equator-network.org/home/.
Did you like this website? Visit http://www.pmean.com/category/WritingResearchPapers.html for related links and pages.
-->Nick News: Nick takes third in his age group in two 5K races. Without any formal training (other than running around like a crazy during recess), Nick has taken home third place medals for his age group in two recent races. In the first race, the Blue Valley Recreation Strut for the Streaks 5K Run/Walk in October, Nick finished in 29 minutes, which was third best in his age group (0-14 year old males). Given that much of his competition was older than him, this was quite an accomplishment. In the second race, the Ward Parkway Thanksgiving Day 5K Run/Walk, Nick finished in 32 minutes, but this was still good for third place in his age group (0-9 year old males). Again, this was an impressive performance because of the large number of runners (at least 1200, though I don't have an exact count of how many were in Nick's group).
Nick doesn't do any training. He just goes out and runs. We'll try to get him involved in a cross-country or track program when he reaches middle school (there's nothing for him at his elementary school). He has a lot of potential. Here are a couple of pictures of Nick and Steve after the two races.
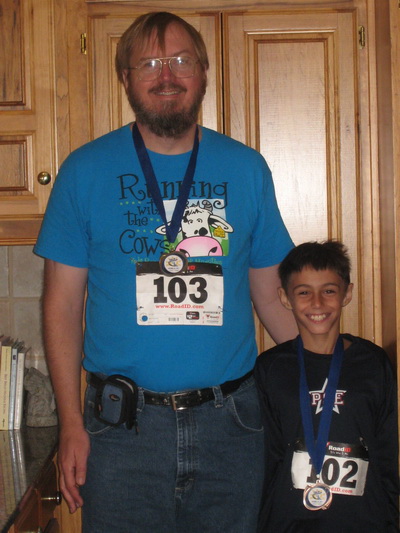
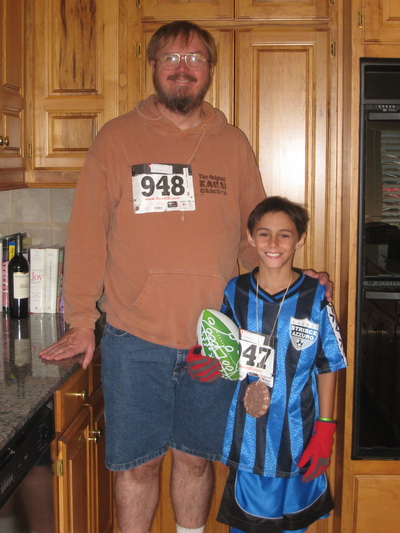
You may notice that I'm wearing a medal in one of these pictures also. I took first in my age group, but with only two participants in the old geezer category (55-59 year old males), I'm not sure how much of an accomplishment this really is. Read more about these races at:
--> http://www.pmean.com/personal/medals.html
--> http://www.pmean.com/personal/TurkeyDay.html
-->Very bad joke: When you're generating a pointless answer to a pointless question, it does not make sense to add pointless complications. I came up with this myself on one of my more cynical days.
-->Tell me what you think. How did you like this newsletter? Give me some feedback by responding to this email. Unlike most newsletters where your reply goes to the bottomless bit bucket, a reply to this newsletter goes back to my main email account. Comment on anything you like but I am especially interested in answers to the following three
questions.
--> What was the most important thing that you learned in this newsletter?
--> What was the one thing that you found confusing or difficult to follow?
--> What other topics would you like to see covered in a future newsletter?
I got four comments about the last newsletter itself and one complaint that I had not sent out another newsletter yet (bless you for noticing). I got praise for the article on ANOVA versus ANCOVA and for the use of confidence intervals to assess clinical importance. Another person liked my comment about people turning their brains off once they got a small p-value. One person didn't care for the search engine optimization story and also found the material on regression to the mean a bit tricky at first. The one suggestion for new material was critical appraisal of regression models.
-->Join me on Facebook, LinkedIn, and Twitter. I'm just getting started with social media. My Facebook page is www.facebook.com/pmean, my page on LinkedIn is www.linkedin.com/in/pmean, and my Twitter feed name is @profmean. If you'd like to be a Facebook friend, LinkedIn connection, or tweet follower, I'd love to add you. If you have suggestions on how I could use these social media better, please let me know.
What now?
Sign up for the Monthly Mean newsletter
Review the archive of Monthly Mean newsletters
![]() This work is licensed under a
Creative
Commons Attribution 3.0 United States License. This page was written by
Steve Simon and was last modified on
2017-06-15. Need more
information? I have a page with general help
resources. You can also browse for pages similar to this one at
Category: Website details.
This work is licensed under a
Creative
Commons Attribution 3.0 United States License. This page was written by
Steve Simon and was last modified on
2017-06-15. Need more
information? I have a page with general help
resources. You can also browse for pages similar to this one at
Category: Website details.