
The Monthly Mean newsletter, March 2013. Released 2013-04-12.
--> Introduction
--> Counting--it's not quite as easy as 1-2-3
--> Definition: What is metadata?
--> Nick News: Nick cooks dinner for us
--> Quote: While it is easy to lie...
--> Trivia: Beethoven wrote nine symphonies, but
--> Very bad joke: My new joke has been...
--> Video: Algorithmic Illusions: Hidden Biases of Big Data.
--> Tell me what you think.
--> Join me on Facebook, LinkedIn and Twitter
--> Permission to re-use any of the material in this newsletter
--> Introduction. Welcome to the Monthly Mean newsletter for March 2013. The Monthly Mean is a newsletter with articles about Statistics with occasional forays into research ethics and evidence based medicine. If you are having trouble reading this newsletter in your email system, please go to the web version (www.pmean.com/news/201303.html). If you are not yet subscribed to this newsletter, you can sign on at the newsletter page (www.pmean.com/news). If you no longer wish to receive this newsletter, there is a link to unsubscribe at the bottom of this email.
--> Counting--it's not quite as easy as 1-2-3.
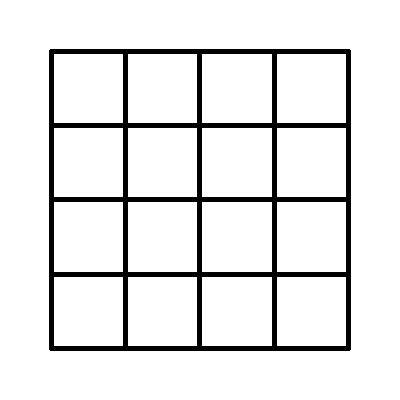
There was a puzzle published in a blog of the Harvard Business Review. The blog is written by Vijay Govindarajan and Srikanth Srinivas, two top experts in business innovation. They presented an image (see below) and asked you to count the number of squares in the picture, explain how you arrived at that number, and explain the "connection (if any) do you see between this exercise and breakthrough innovation." This was to be done in the comments section of the blog entry.
Before I tell you the answer, take a minute or two and count the squares yourself.
This puzzle intrigued me because I have given several talks on how difficult counting really is. Here's an example that I used in one of my lectures to illustrate the difficulty of counting.
If you try this on a group of students, you will get a wide range of answers. There are several reasons why people could come up with different answers. First, there is human error--it's easy to miss a letter or two. Second, there are ambiguous situations--did you include the sentence of instructions in your count? Third, people may apply different standards--do you include capital letters in your count?
The point I was trying to make with this letter counting exercise is that if you start counting with only a vague idea of what "counts" then you will find that the counts vary depending on who is doing the counting. To insure consistency, you must define things clearly.
So, getting back to the square exercise, let's define what a square is. It is a geometric shape with four sides of equal length and four right angles. So let's start counting.
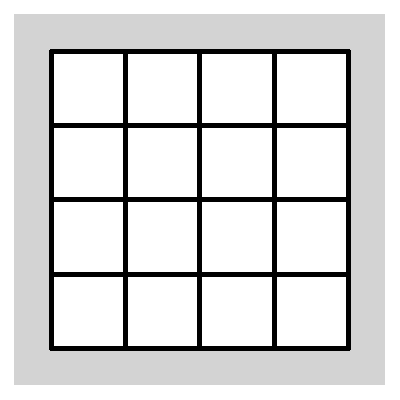
Well there are the small one by one squares.
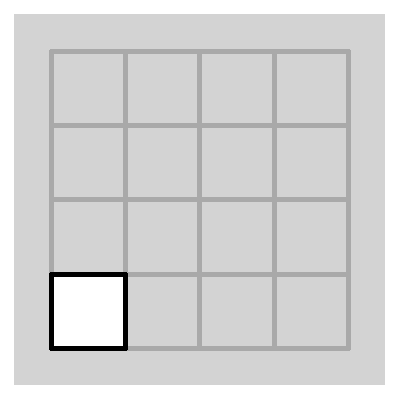
Here's one. There are a total of 16 of these. Now let's look for bigger squares, first the two by two squares.
There's a technical problem here, but I will sidestep it for the moment. A different, but equally important question is how do you count the two by two squares? It's a bit tricky because they can overlap. I did a count by looking for the interior plus signs.
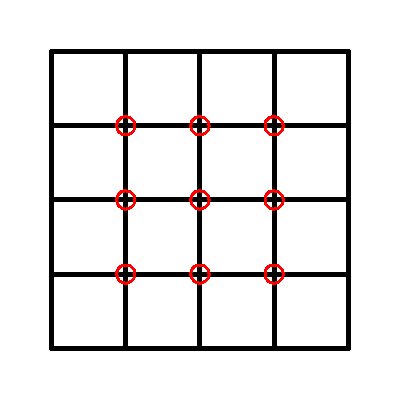
There are nine of these, each corresponding to a different two by two square. Now look for the three by three squares.
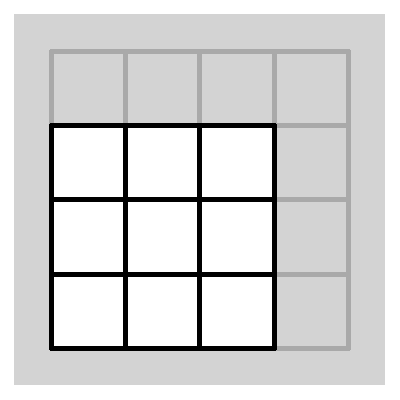
Here's an example. Again there is some overlap, so to be careful about it, note that each three by three square has a single interior square. There are four interior squares in the entire figure, so that means four three by three squares.
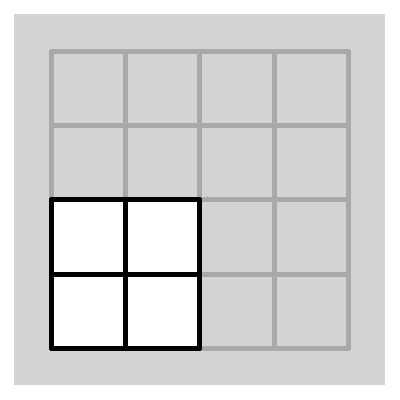
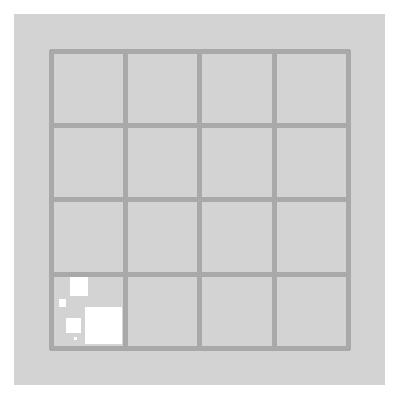
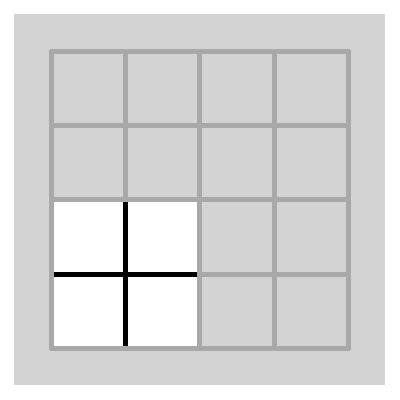
Finally, there is a single big four by four square. Add up the results: 16 + 9 + 4 + 1 = 30. So there are thirty squares. But that's not the answer that the bloggers were looking for. They are a bit coy, but I think they like an answer that is twice as large. How do they find the extra squares? Well, first, there are some white squares hiding within the figure.

Here's one. Half of me thinks that this is clever but half of me starts to worry. I defined a square as a geometric shape with four sides of equal length and for right angles. But really, I had a different definition in mind. A square is a the geometric shape with four equal sides and four right angles, but it also has to be a region with an interior of one color and a border of a different color. Now think about this definition for a bit. The two by two squares and larger have an interior that is a mix of black and white pixels. So this definition is not the one I used. I had instinctively defined a square based solely on its border. So the definition I was implicitly using was something along the lines of this: a square is four continuously connected line segments each of equal length and each meeting at a right angle. Boy this is getting complicated.
But the definition of square used by the bloggers is problematic also. They did not provide an operational definition, but you can infer one, perhaps. A square is a region of a single color with four sides of equal length and four right angles. It may or may not be surrounded by a border of a different color. That sounds good, doesn't it? But when you define a square this way, there are an infinite number of squares in this figure.
Here are five, just to show you some examples. Each of these meets the definition of "square." So we need to rethink the definition. A square is a region of a single color with four sides of equal length and four right angles. It may or may not be surrounded by a border of a different color, but the pixels directly adjacent to but outside the square have to be a different color. So now, what is the difference between "pixels directly adjacent to but outside the square" and "border"? Another way of thinking of this is to ask yourself "If you remove the border from a square, does it become a different square?" I would argue no. In my image, the borders are five pixels wide (it might be slightly different on your computer system). Suppose we shaved off the outermost layer of pixels, leaving a border of four pixels. Is this a different square? Of course not. So how come when you shave off all of the black pixels, it suddenly becomes a different square? To count the white interior of a one by one square as a separate and distinct square is just artificially increasing the number of squares so that your answer is larger, and therefore better. This is Enron creativity.
Now those white squares, if they are legitimate, add 16 to number of squares giving you a total of 46. We have some more squares to find. How about the interior of the two by two squares.
Here's an example. But by what definition could you call this a square? The interior is a mix of black and white pixels and the border is a mix of black and white pixels. It's not a square--it's a plus sign.
The more I think about this problem, the more it reminds me of the famous Humpty Dumpty quote: "'When I use of word, it means just what I choose it to mean." If you want to be creative, you could produce squares out of anything. You could see a triangle and call it a three sided square.
I've gone on way too long about this. It seems like arguing how many angels can dance on the head of a pin. Perhaps, but let me show you a more pragmatic example of counting that is closely related to the same problem.
Lab technicians are often asked to count cells of various types. This allows you to estimate a concentration, which is measured as millions of cells per cubic centimeter or something comparable. What you do is place the sample on a slide with a well of a fixed depth marked with squares of a fixed size. Then, under a microscope, you count the number of cells in a microscope that fall inside those squares. Since the size of the squares and the depth of the well are known, you can calculate a total volume. The ratio of the count to the volume is the concentration. There are automated ways to do this, such as with a flow cytometer or an image analysis program, but manual counting is still commonly done.
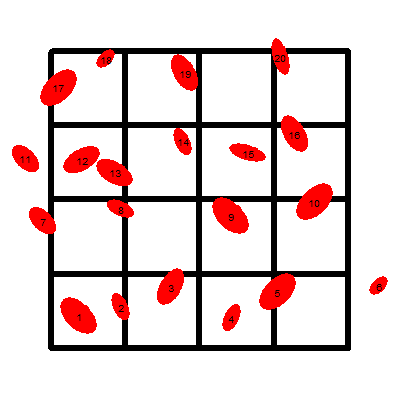
The above image is an abstract visualization of the process. Start in each square and count the number of cells. Add these values together. So there are two cells in the first square. That seems easy enough. But how many cells are in the second square? One? Two? If you say two, then you are double counting cell #2.
So you need to establish a rule: don't count a cell in one square if you already counted it in an earlier square. Now, I don't like this rule because it requires you to remember which cells have been counted and which ones have not. That seems rather error-prone, but it does resolve the problem of double counting. We keep counting, and skip cell #6 which is obviously outside the counting region. But what about cell #7? It seems a bit dangerous to count a cell that is only part of the way inside the square region, but it seems equally dangerous to exclude a cell unless it is entirely inside the region.
There are several ways to resolve this. At first blush you might say something like "Count it if more than half of the cell is inside." That's fine in theory, but I suspect that there will be enough situations where it is really hard to tell whether half of the cell is inside.
A simple and relatively stable alternative is to count a cell if it is on the upper or right hand border, but to ignore it if it is on the lower or left side border. By this criteria, cell #7 is excluded, but cells #17 and #20 are included. The nice thing about this rule is that it also helps avoid double counting. Cell #2 belongs in the first square and not the second square because it touches the right hand edge of the first square but the left hand edge of the second square.
If you wanted to, you could define what happens with a cell that touches both the left side and the upper side. I've gone way overboard again, but the whole point of this is that counting the cells inside a square require you to define what you mean by "inside."
Here's another example of ambiguity in counting. Suppose you are doing a mortality study and want to count the number of people in the Kansas City metropolitan area who die from heart attacks in 2012. First, of all, "heart attack" is itself a pretty ambiguous word, but we can firm this up a bit. But another source of ambiguity arises when you consider where a person died. If you are using hospital records, you'll leave out the person who died at home and never made it to the hospital. It is similar to deciding what is "inside" in the cell counting exercise.
Here are some more examples. How do you define someone as a non-smoker? Should it include the person like me who took one puff of a cigarette at the age of six and hacked and coughed so much that they never looked at another cigarette without turning green? By any reasonable definition, this person is a non-smoker. So you have to create a threshold, such as you are a non-smoker if you've smoked fewer than 100 cigarettes in your entire lifetime.
Classifying someone based on dietary exposures is also tricky. You might be classified as exposed to caffeine if you drink regular coffee, but what about tea or soda? What about the caffeine in chocolate?
This is a very important but often ignored issue in observational studies. These studies have groups that are labelled "exposed" and "unexposed" or "cases" and "controls". Simply counting the numbers in each group is tricky because these groups can be "leaky." When you are counting the number of exposed patients, some of the exposed patients can leak out or some unexposed patients can leak in. If you want to run a good research study, you need plug these leaks as best you can and you also need to document these groups with sufficient precision so that another person who is reasonably familiar with the research area could reproduce your counts without having to consult you first.
The whole moral of the square counting exercise: Think carefully about what counts before you start counting.
For more information, you can read the original blog entry, or a follow-up entry. I made a comment on the blog site, which I reproduced on a page of my own website. No, I did not win one of the books, but they did say that my comments might get published in the print version of the Harvard Business Review.
Did you like this article? See more like it on my Data Management page.
--> Definition: What is metadata? Metadata is information about a data set that you need to know in order to understand and use the data. The type of metadata depends largely on the data itself, but it might include information about when the data was collected, where it was collected, and who collected the data. If the data comes from an automated system, then it might include information on the settings used by that system. So a photograph might have metadata on the date of the photograph, the GPS coordinates for the location where the photograph was taken and the shutter speed, ISO, and aperture used in taking the picture.
In Statistics, you would use metadata to describe information not just about the data set as a whole but also about individual variables in a data set. This might include units of measurement, what specific codes mean, the values that would be used to represent missing data (and why the data are missing).
Many microarray experiments store metadata with the data itself using a format like XML (extended markup language). In fact, you can use the metadata from microarray experiments to examine problems with the conduct of the research, such as failure to randomize the order in which samples were processed.
Statistical software may include metadata with the data. SPSS, for example, will use the VALUE LABEL to store metadata about categorical data. SAS uses a FORMAT statement instead and R uses the FACTOR function. Databases can often store metadata as part of the database.
You can also store metadata as a separate file. To see an example of this, go to this webpage describing one of the data sets in the Australian Data and Story Library or this PDF document describing the 2009 version of the National Hospital Ambulatory Care Survey. Note that the second set of metadata is 275 pages long!
Did you like this article? See more like it on my Data Management page.
--> Nick News: Nick cooks dinner for us. At Boy Scout campouts, the kids are expected to cook their own meals. Nick is new to this, but seemed to enjoy one of the lunches which involved chopping up peppers, onions, and Polish sausage, and grilling it in a pan over a propane stove. Last night, he decided to try this out on us (without the propane, of course).

He's using two separate pans because he just wanted the Polish sausage and not the peppers and onions. But after he was done, he did eat a few of the peppers and onions. Everyone enjoyed the meal and Cathy suggested that we put Nick to work once a week to cook dinner for the family.
--> Quote: While it is easy to lie with statistics, it is even easier to lie without them. Frederick Mosteller. Source: Wikiquote.
--> Trivia: Beethoven wrote nine symphonies, but there is something special about the third, sixth, and ninth symphonies (other than the fact that all of these are divisible by three). What is the common tie? First person to answer correctly gets mentioned in the next newsletter.
No one answered last month's question, either because it was too hard or because they didn't care. Here's the question again. Most movie sequels include the number "2" in their title (Godfather, Part 2) and sequels of sequels usually have the number "3" in their title (Toy Story 3). Can you name a sequel that has a number other than "2" in its title and a sequel of that sequel that has a number other than "3" in its title? There are actually, at least two good answers here. Star Wars: Episode V: The Empire Strikes Back, and Star Wars Episode VI: The Return of the Jedi, both sequels to the original Star Wars movie (which was retroactively given the title Star Wars Episode IV: A New Hope). The other answer that I could come up with was Ocean's Twelve and Ocean's Thirteen, both sequels to Ocean's Eleven.
--> Very bad joke: My new joke has been well-received: an analyst finally installs every package on ssc and opens @Stata without further ado! This is a tweet from Lindsey Shaughnessy @internetlindsey. If you've never used Stata, don't bother trying to figure out this joke.
--> Video: Kate Crawford. Algorithmic Illusions: Hidden Biases of Big Data. Description: "Big data gives us a powerful new way to see patterns in information -- but what can't we see? When does big data not tell us the whole story? This talk opens up the question of the biases we bring to big data, and how we might work beyond them." [Accessed on April 2, 2013]. Source: YouTube.
--> Tell me what you think. How did you like this newsletter? Give me some feedback by responding to this email. Unlike most newsletters where your reply goes to the bottomless bit bucket, a reply to this newsletter goes back to my main email account. Comment on anything you like, but I am especially interested in answers to the following three
questions.
--> What was the most important thing that you learned in this newsletter?
--> What was the one thing that you found confusing or difficult to follow?
--> What other topics would you like to see covered in a future newsletter?
If you send a comment, I'll mention your name and summarize what you said in the next newsletter. It's a small thank you and acknowledgement to those who take the time to help me improve my newsletter. If you send feedback and you want to remain anonymous, please let me know.
I received feedback from several people.
David McArthur disagreed with the advice I gave on data entry. Not just any disagreement, but one that required "prompt and quite vociferous objection." I'll see if I can summarize his points here, because he raises an important issue. The first problem was my recommendation about missing data.
"Using oddball numeric values is satisfactory only when each of those values can be instantly, unambiguously, and forevermore associated with a particular codebook; when that codebook gets misplaced or simply overlooked (as is inevitable) your goose is cooked."
He goes on to advise
"I never ever allow numeric missing value codes, *because we simply don't need them*. Always and only use text, such as the word "missing" or "NA" or "blank" or the phrase "not recorded" or "signal lost" or indeed any relevant text that is immediately decipherable without a codebook. It's not a code, therefore; it's an actual textual statement of the nature of the missingness in that cell."
During the import of this data into a program like R, it is easy to insure that these codes are converted to missing values.
"Having all the missing values presented and accounted for in a way that everyone, not just the analyst, can instantly tell what's happening beats numeric equivalence coding tied to mandatory reliance on the analyst's codebook hands down. And saves time and energy for far more important stuff."
He noted something rather perceptive in the postscript as well.
"If it's one's current software that is forcing the use of those oddball numeric values because it can't cope with concurrent text, then it's high time to swap software."
My advice was originally written fifteen years ago. I recycle a lot of old material for this newsletter and sometimes I forget to update things properly. Yes, I was using software (SPSS) that had some difficulty mixing numbers and text in a single variable. That problem has since been fixed, but back then, when SPSS imported data, it decided to use a numeric format or a string format based on the first observation it saw.
David McArthur also dislikes the use of number codes for categorical data. They can lead to inconsistencies as he "respectfully and cheerfully" pointed out that I did myself in my example. He likes the use of letter codes instead of number codes.
"I continue to think that simple unambiguous textual acronyms like "y" and "n" are as easy to enter into a dataset as any arbitrary number on the keyboard at the same time as reducing exactly this opportunity for possible confusion to a minimum."
Maybe, but number codes are not without their advantages. Number codes allow you to easily control the order in which categories are displayed. They don't suffer from the ambiguities of case ("Y" and "y", for example). But many of the reasons I prefer numeric codes have to do with working around limitations of software. Several statistical programs, for example, will not allow you to place letter codes on an axis of a scatterplot. There are workarounds for this, of course, but Dr. McArthur's point about seeking out better software is still worth noting here.
I can nitpick Dr. McArthur's advice or offer counter examples, but it is best to just let it stand on its own. Part of the difficulty is that I pulled this material out of the lecture notes for a three hour class. In the three hour class, I talked about entering data, defining missing values, and attaching value labels all as part of a single operation. In fact, I did the data entry last--after defining missing value codes and value labels. I made a mistake when I pulled out the section on data entry because I failed to provide the broader context. I appreciate the opportunity to discuss this in more detail.
I have to say that I appreciated such a detailed critique, and I exchanged a couple of email with Dr. McArthur to insure that I understood what he was saying and to also get permission to include his helpful comments here. I wish that more of my readers would raise vociferous objections, as it helps me improve my newsletter.Others provided valuable feedback as well.
Dawn Marie Evans liked the article on literature review.
Ed Gracely liked my guidelines for data entry. He had a helpful suggestion. Try to use the same code for missing values throughout all the variables in your data set. It makes it a lot simpler because you can take care of missing value coding all in one fell swoop.
An anonymous reviewer liked my tutorial on data entry. He also found the perfect quote for the other article. It was Voltaire and he said "Le mieux est l'ennemi du bien." Source: Wikiquote. He also was interested in the recommended book on imputation.
Another anonymous person gave me the quote "Better is the enemy of good enough." N. G. Ogarkov. I'm glad he translated from Russian. Apparently, this was a Red Army general who was fighting the belief that an average operating time of 300 hours for a jet fighter engine was okay because the war would be over before the engines wore out. The same anonymous person liked the advice on missing values in the article on data entry, but was confused by the discussion of Medline and Google Scholar in selecting articles for a systematic overview.
--> Join me on Facebook, LinkedIn, and Twitter. I'm just getting started with social media. I have pages on Facebook and LinkedIn, and my Twitter feed name is @profmean. If you'd like to be a Facebook friend, LinkedIn connection (my email is mail (at) pmean (dot) com), or tweet follower, I'd love to add you. If you have suggestions on how I could use these social media better, please let me know.
--> Permission to re-use any of the material in this newsletter. This newsletter is published under the Creative Commons Attribution 3.0 United States License. You are free to re-use any of this material, as long as you acknowledge the original source. A link to or a mention of my main website, www.pmean.com, is sufficient attribution. If your re-use of my material is at a publicly accessible webpage, it would be nice to hear about that link, but this is optional.
What now?
Sign up for the Monthly Mean newsletter
Review the archive of Monthly Mean newsletters
Take a peek at an early draft of the next newsletter
![]() This work is licensed under a
Creative
Commons Attribution 3.0 United States License. This page was written by
Steve Simon and was last modified on
2017-06-15.
This work is licensed under a
Creative
Commons Attribution 3.0 United States License. This page was written by
Steve Simon and was last modified on
2017-06-15.