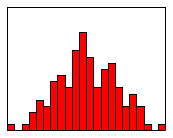
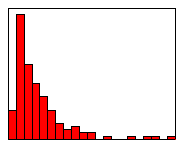
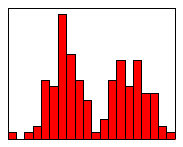
When you plot your data in a histogram (or a stem and leaf diagram), you should look for patterns. Here are examples of three of the most important ones.
When you plot your data in a histogram (or a stem and leaf diagram), you should look for patterns. Here are examples of three of the most important ones.