Someone asked me for a sample size justification for a study involving a historical control group of 30 patients and a treatment group of unspecified size. I thought it would be nice to document the mechanics of this calculation here, as an example for future clients. It uses a program, Piface, developed by Russ Lenth for sample size calculations.
I was not told how many patients they expected to get in the treatment group, but there are three possible choices that you could investigate as a starting point for further discussion, a treatment group of equal size to the control group, a treatment group twice as large as the control group, and a treatment group half the size of the control group. The last choice is a hard sell to an IRB that has been a bit skeptical in the past of some of my other sample size justifications, so let’s concentrate on the first two choices.
The outcome measure has a standard deviation of 11 based on previously published research. The researcher did not specify a minimum clinically important difference, but in a previous project has suggested a value of 15. I think we can do a bit better than that for this study.
I want to show screen shots of a program called Piface, that is available for free at Dr. Russ Lenth’s website. Here’s the splash screen.

Dr. Lenth’s son, Brian, did the artwork here. After you click OK, you get the following window.
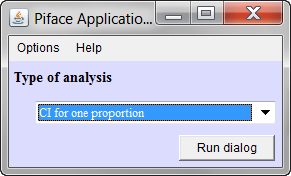
Since the outcome is continuous and since there is no pairing or matching between the control group and the treatment group, an independent (two sample) t-test is worth looking at. If we want to consider something later on that involves matching or risk adjustment, we would have to look at a more complex model. Select the “Two sample t test” under “Type of analysis”,
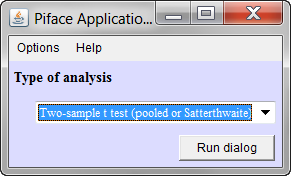
and then click on the “Run dialog” button. This is what you get.
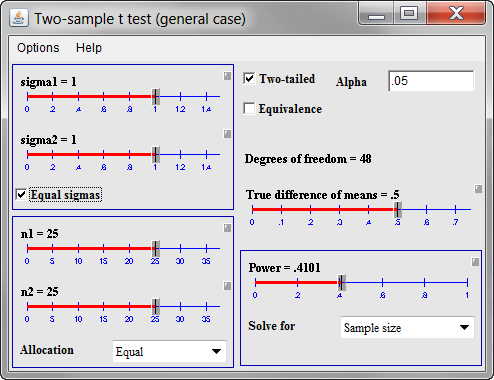
The default option in Piface is to use sliders, which are very nice for “what if” calculations. But you can switch from sliders to direct data entry by clicking on the small gray box above and to the right of each slider.
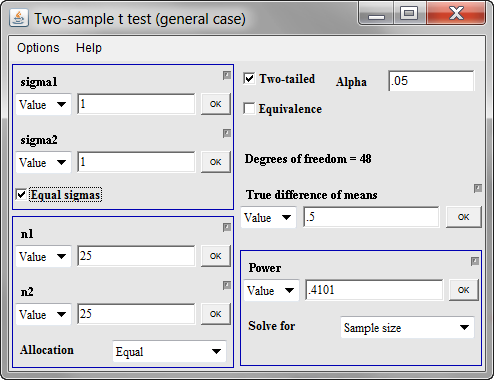
Let’s start with both standard deviations (sigma1 and sigma2) being equal to 11. There is no strong belief that the treatment data will be substantially more variable or substantially less variable than the control data. Also set both sample sizes (n1 and n2) for now to 30. I’m not sure what will work here, but let’s try 15 for the minimum clinically important difference (true difference in means). Once you enter the 15 and click on OK, you get the following window.
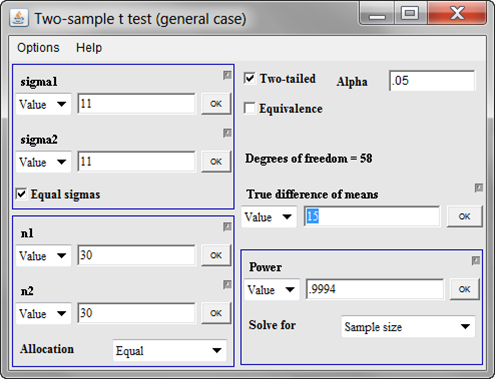
Whoa! That’s 99.94% power. Generally, anything this large means that we have a bit of “wiggle room” and can afford to either decrease the overall sample size or decrease the minimum clinically important difference. At this point, I would opt for the latter, but this is something you should discuss with the client. So what if we wanted to be able detect differences of size 10 rather than 15. What would this do to our power? Replace the 15 in the true difference of mean entry field and you get this.

We have 93% power. That’s still very good. You might ask yourself, what difference in means could we detect with 80% power. There’s a general comfort level among many researchers with a power of 80%, though I’ve seen some hints that 90% power may make more sense in some contexts. Nobody really thinks this through very carefully, and if you wanted to do this well, you’d estimate the cost of a false positive research finding, the cost of a false negative research finding, and try to balance your beta error (1-power) and your alpha error. No one expects this level of detail, though, unless you are talking about a really expensive clinical trial.
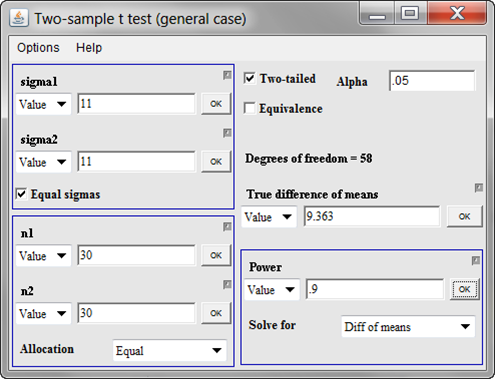
To get the difference in means that you could detect with 80% power, change the “Solve for” field to “Diff of means” and put 0.80 in the “Power” field.

Now, let’s see what we could get at 90% power.
Now, at this point, we could look at 30 in the control group and 60 in the treatment group, but I suspect that this would be overkill. We already can detect what I might consider pretty small changes in the outcome variable. This is where you need to have more discussions with your client. I would recommend that we write up something like the following:
With a sample of 30 historical controls and 30 patients in the [treatment] group, we would have 93% power for detecting a 10 unit shift in [the outcome variable]. This is based on a two sample t-test with a common standard deviation of 11 (based on [cite your reference here]) and a two-sided alpha level of 0.05.
I try to write these statements with enough detail that another statistician could look at it and reproduce my calculations. In this example, it means that you mention
- the statistical test being used
- the standard deviations
- the sample sizes
- the minimum clinically important difference
- the alpha level
- whether the test is one sided or two sided, and
- the power
Why didn’t I use the 90% power or 80% power scenarios? It’s just my personal preference. I would rather have the minimum clinically important difference be a nice round number than have the power be a nice round number. But there is nothing wrong with presenting any of these scenarios. Just substitute in the appropriate values.
Now further discussions would be warranted here. I’m guessing that the researchers would be very happy with a research design that could detect a difference as small as 10 units, mostly because I have worked with them on similar projects before. I’m also assuming that getting 30 treatment patients is easy (the number of control patients is fixed at 30 because it is a historical control group). These are pretty big assumptions. I don’t have problems with making assumptions like this because it offers them something to react to, but I would never publish a sample size justification like this without first confirming these assumptions.
Further work is needed here. Perhaps they were thinking of 20 patients in the experimental group, and this might be reasonable, depending on what they were using as their minimum clinically important difference. But hopefully we’ve made some progress.
Note that I could have tried to pin them down more at the beginning. This researcher was a bit vague about the minimum clinically important difference and didn’t really mention whether a sample size for the experimental group equal to, larger than, or smaller than the control group was what they were looking for. But when you are doing this sort of thing by email, asking them to pin things down precisely before you do any sample size justification will slow down the process versus giving them what you think is a plausible scenario and letting them make adjustments to that scenario. There’s a risk here that your client will take your scenario as fixed and mandated by the needs of the statistics, but I know this client well enough that I don’t have to worry about this.
I haven’t presented these results yet, so I don’t have a report on what the reaction will be. If I’m way off on my assumptions, I may write a new blog entry or add to this blog entry.