In an earlier blog post, I slogged through the calculation of power for a test of association in a two by two table. You can also approximate power using a simulation. It is done quite easily in R, but I want to show it in SPSS. Why? Just because.
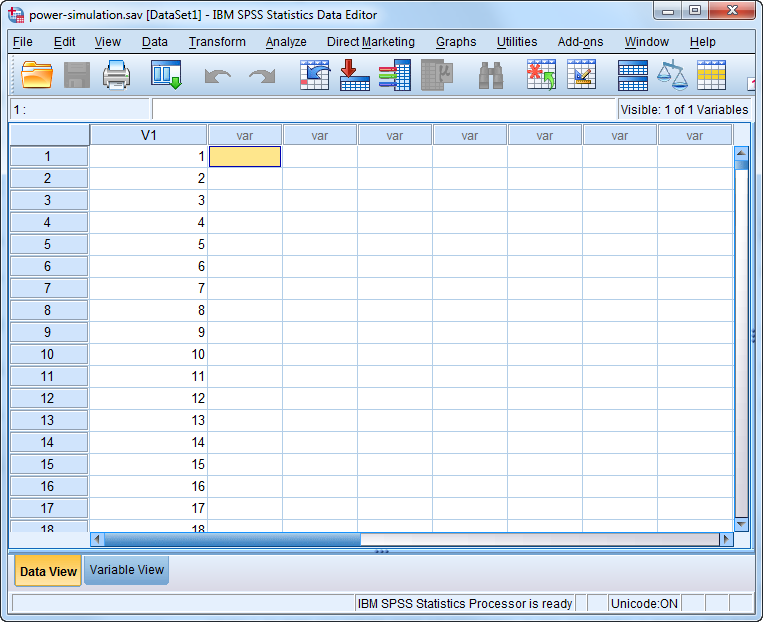
First set up a column in SPSS that represents a counter for each row. It should go from 1 to 10,000, but for the sake of simplicity, I am only showing the first ten rows. Now, you don’t have to type the numbers 1 to 10,000. Open an Excel spreadsheet, put 1 in the top leftmost cell, 2 in the cell beneath it, highlight both cells, and then extend down to 10,000. Import this file into SPSS.
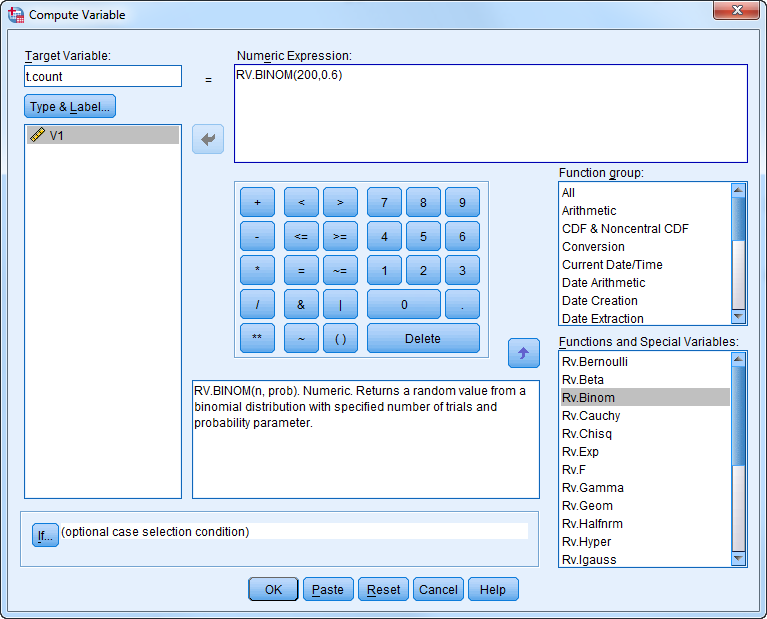
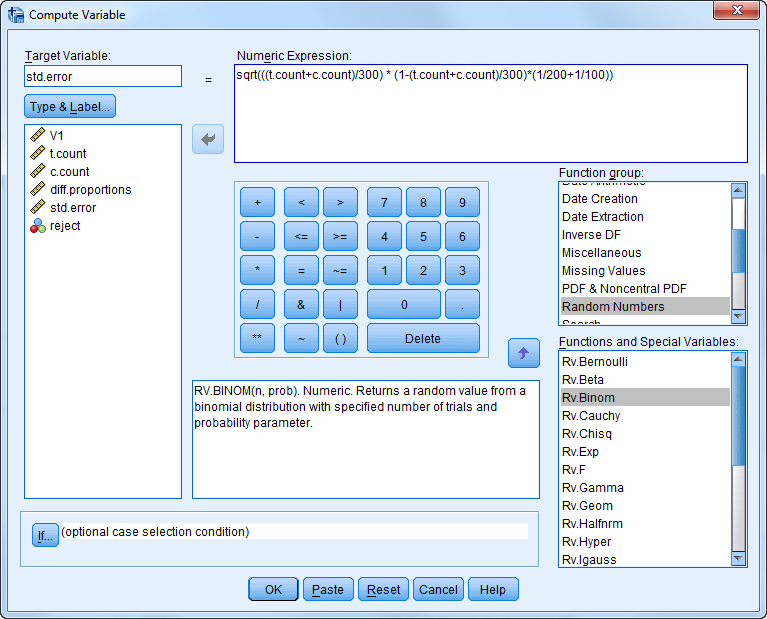
Now, we want to compute the power of a test of association in a two by two table where the treatment group has 200 patients and a probability of success of 60% and the control group has 100 patients and a probability of success of 50%. We want a one-sided test at an alpha level of 0.05. First simulate the number of successes in the treatment group as binomial with n=200 and p=0.6.
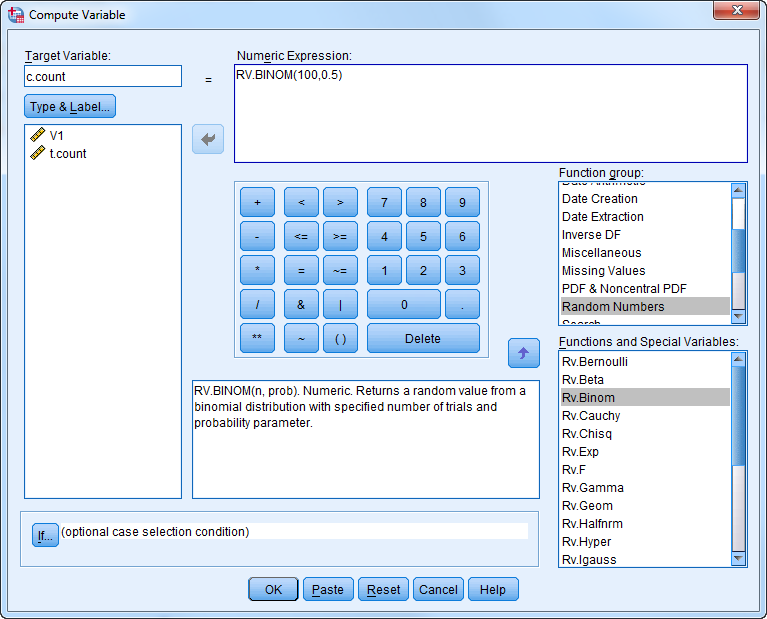
Next simulate the number of success in the control group as binomial with n=100 and p=0.5.
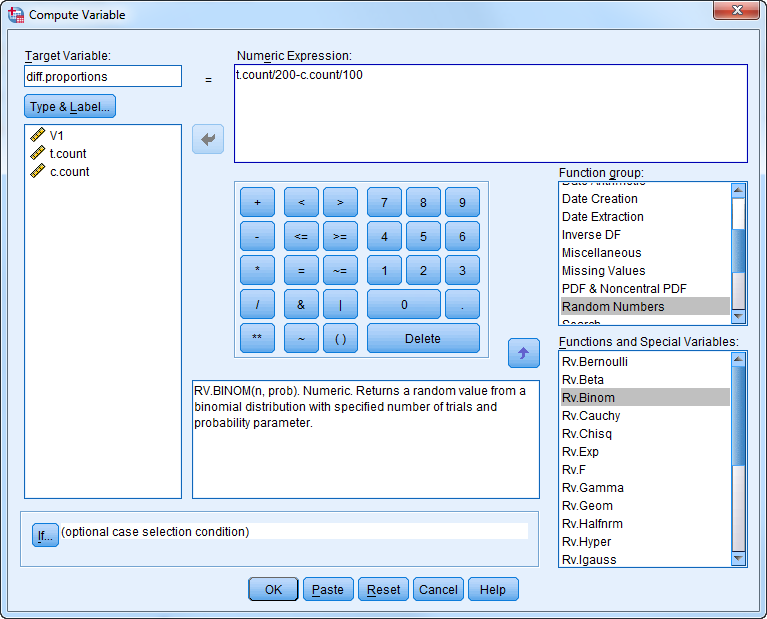
Calculate the difference in proportions
and the standard error.
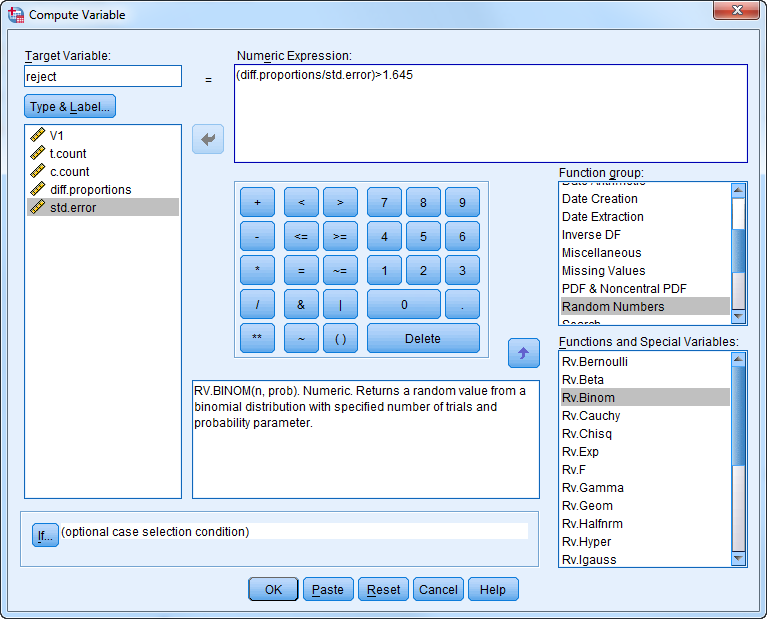
Then calculate for each row whether you exceeded the 0.95 percentile of a standard normal distribution.
Here’s what the first few rows of your simulation look like.
Now tally your results.
Hey look at that. You rejected the null hypothesis exactly 50% of the time. That means that your power is 50%. Re run this simulation with twice as many subjects in each group. What do you get?