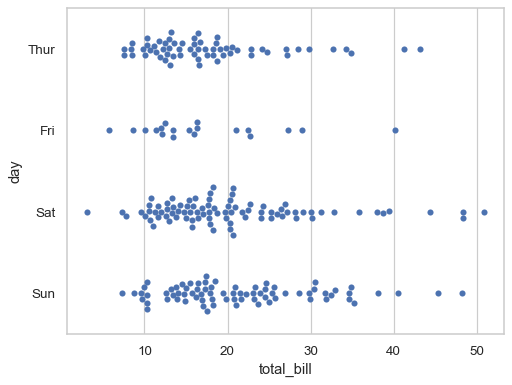
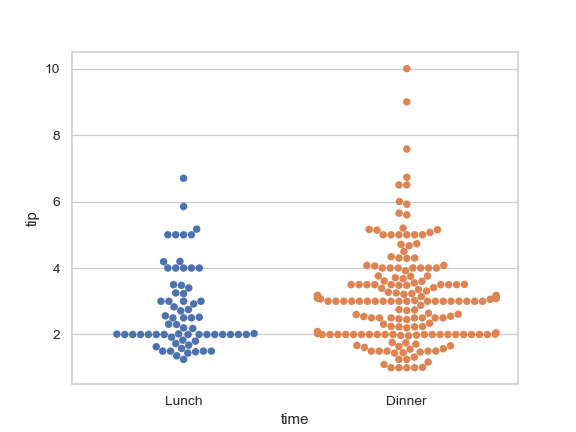
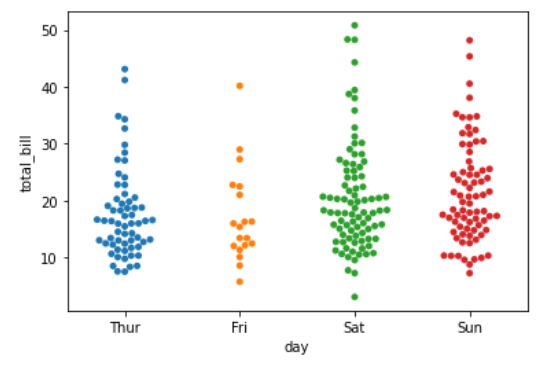
I came across a new type of plot yesterday, a swarm plot. It looks like an interesting alternative to jittering. You can create these graphs using the seaborn library of python, written by Michael Waskom and the beeswarm library of R, written by Aron Eklund. The actual algorithm is not quite obvious, but here are some examples.

This example was found on searborn.pydata.org.

This example was found on stackoverflow.com.

This example was found on geeksforgeeks.org.
An earlier version of this page was published on new.pmean.com.