par(mar=rep(0.1,4))
plot(c(-1,2), c(0, 216), type="n", axes=FALSE, xlab="", ylab="")
polygon(x=c(-1, 0, 0, -1), y=c( 0, 0, 88, 88), col="pink", border=NA)
polygon(x=c( 2, 1, 1, 2), y=c( 0, 0, 120, 120), col="pink", border=NA)
polygon(x=c( 0, 1, 1, 0), y=c( 0, 0, 48, 48), col="pink", border=NA)
polygon(x=c(-1, 0, 0, -1), y=c(216, 216, 88, 88), col="lightgreen", border=NA)
polygon(x=c( 2, 1, 1, 2), y=c(216, 216, 120, 120), col="lightgreen", border=NA)
polygon(x=c( 0, 1, 1, 0), y=c(216, 216, 160, 160), col="lightgreen", border=NA)
segments(-1, 0, 2, 0)
segments(-1, 216, 2, 216)
segments(-1, 88, 0, 88)
segments( 1, 120, 2, 120)
segments(-0.5, 48, 0, 48, lty="dotted")
segments(-0.5, 160, 0, 160, lty="dotted")
segments( 1.5, 48, 1, 48, lty="dotted")
segments( 1.5, 160, 1, 160, lty="dotted")
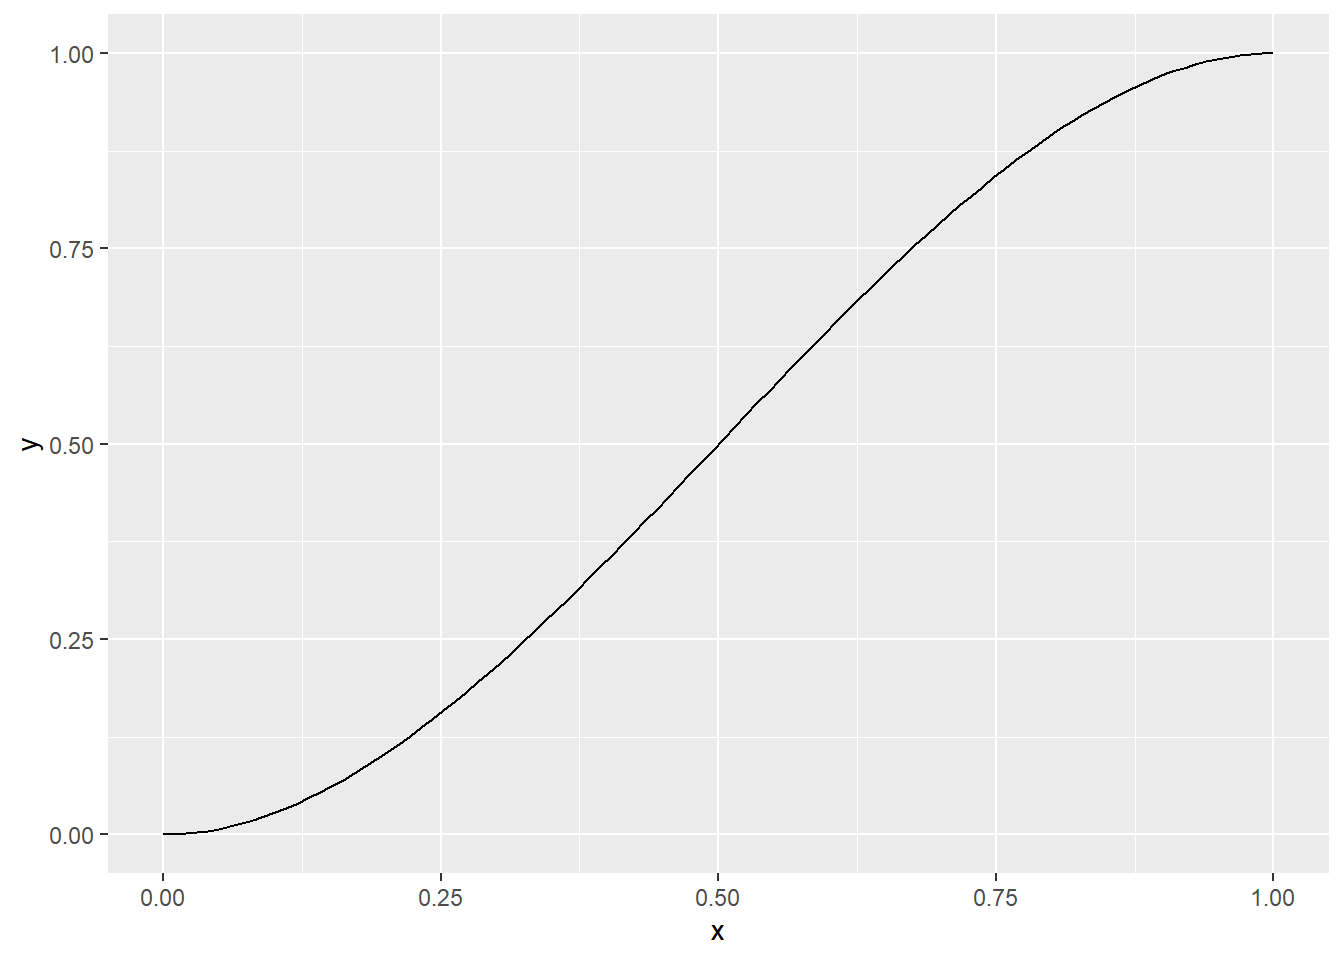
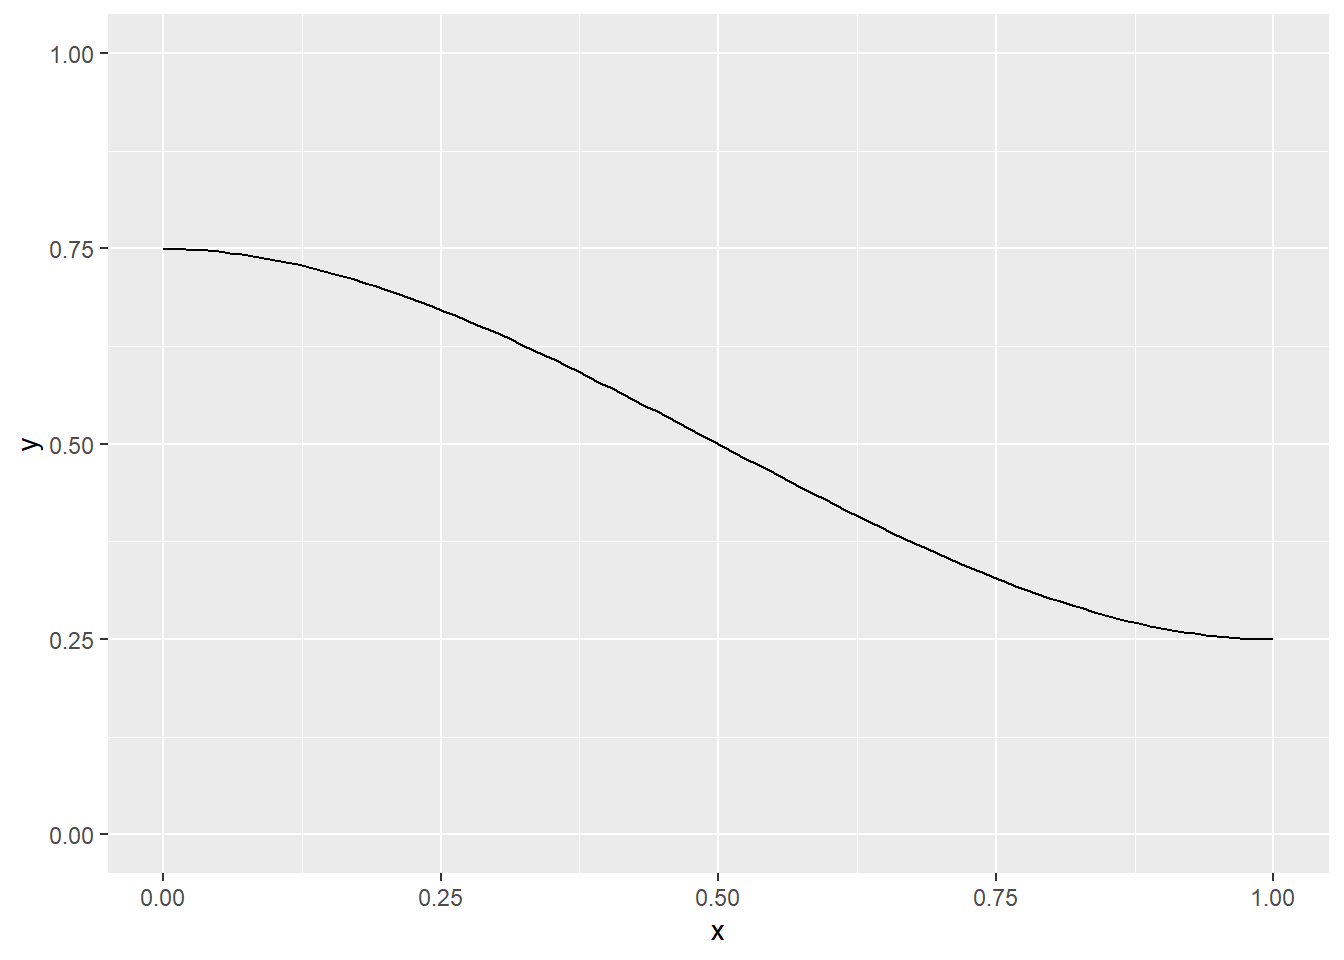
x <-seq(0,1, length=100)
y <- 3*x^2-2*x^3
for (i in 1:length(x)) {
segments(x[i], 160-40*y[i], x[i], 88-40*y[i], col=rgb(floor(colorRamp(c("lightgreen", "pink"))(x[i]))/255), lwd=3)
}
lines(x, 88 - 40*y)
lines(x, 160 - 40*y)
lines(x, 160 + 0*y)
for (i in 1:length(x)) {
segments(x[i], 48+72*y[i], x[i], 88+72*y[i], col=rgb(floor(colorRamp(c("pink", "lightgreen"))(x[i]))/255), lwd=3)
}
lines(x, 48 + 0*y)
lines(x, 48 + 72*y)
lines(x, 88 + 72*y)
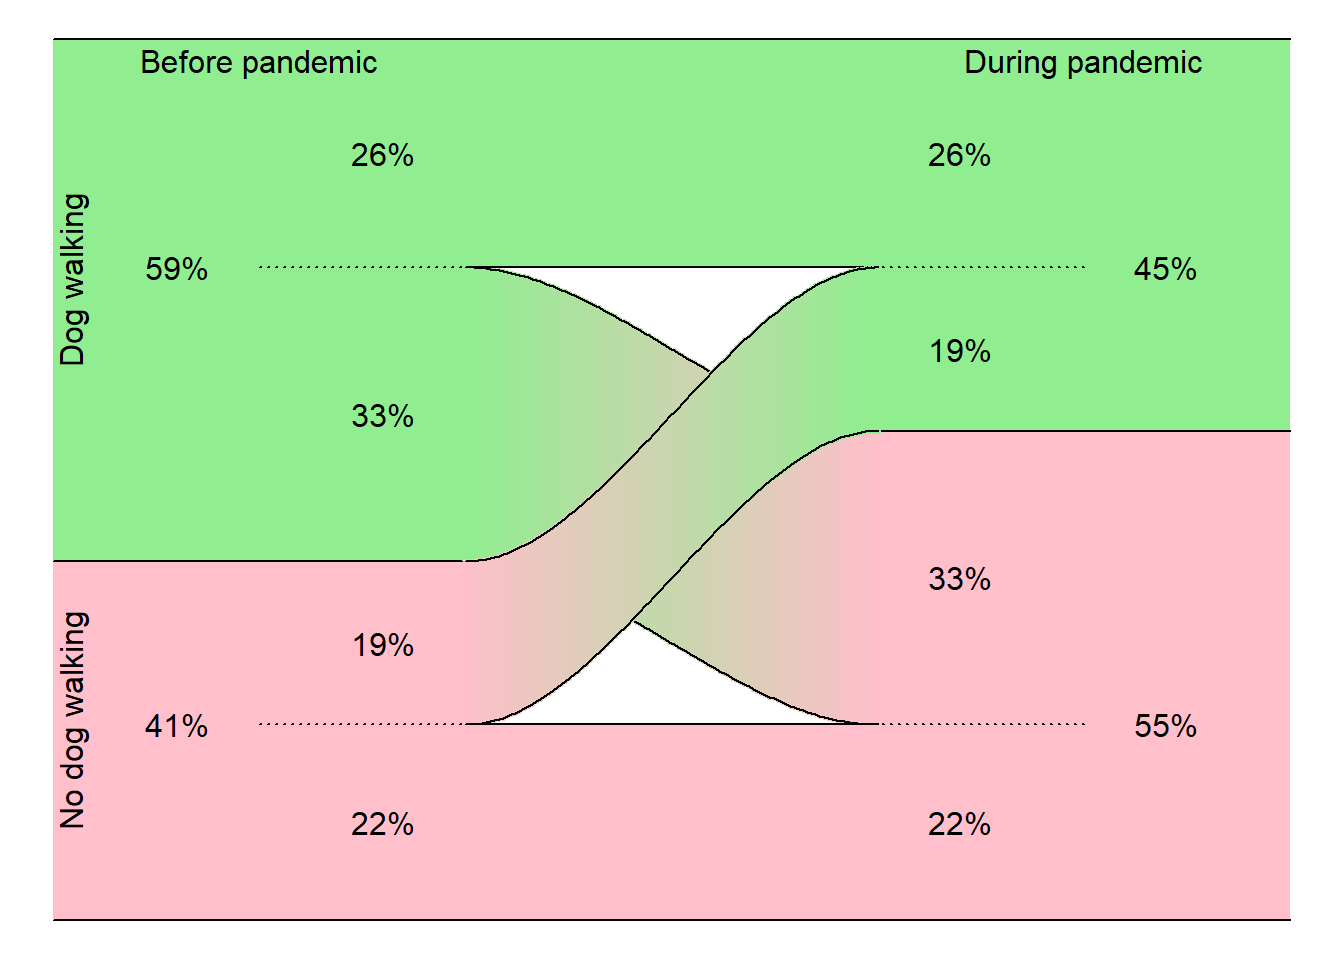
text(-0.95, 49, "No dog walking", srt=90)
text(-0.95, 157, "Dog walking", srt=90)
text(-0.5, 210, "Before pandemic")
text( 1.5, 210, "During pandemic")
text(-0.7, 48, "41%")
text(-0.2, 24, "22%")
text(-0.2, 68, "19%")
text( 1.2, 24, "22%")
text( 1.2, 84, "33%")
text( 1.7, 48, "55%")
text(-0.7,160, "59%")
text(-0.2,188, "26%")
text(-0.2,124, "33%")
text( 1.2,188, "26%")
text( 1.2,140, "19%")
text( 1.7,160, "45%")