The geometric mean is a measure of central tendency, just like a median. It is different than the traditional mean (which we sometimes call the arithmetic mean) because it uses multiplication rather than addition to summarize data values.
The geometric mean is a useful summary when we expect that changes in the data occur in a relative fashion. Here are some examples where we would expect relative changes:
- Filters will trap dusts in an amount relative to the amount of air flowing through them.
- Adjustments in salary are often a percentage amount.
- Kidney enzymes usually metabolize drugs in proportion to the amount of drug in the blood.
Geometric means are often useful summaries for highly skewed data. They are also natural for summarizing ratios. Don't use a geometric mean, though, if you have any negative or zero values in your data.
Consider a dataset looking at an index representing the ability of an infant to metabolize certain types of drugs. We measured infants at two weeks of age and a separate group of infants at six months of age. The data set are shown below:
Age Metab AgeGroup
 14  17.1        1
 14   1.8        1
 14  25.5        1
 14   5.3        1
 14   1.9        1
 14   5.8        1
 14   7.9        1
 14   3.5        1
 14   5.6        1
 14   7.5        1
179   0.9        2
179   2.2        2
181   0.8        2
181   1.5        2
181   0.5        2
181   1.4        2
182   1.1        2
182   1.0        2
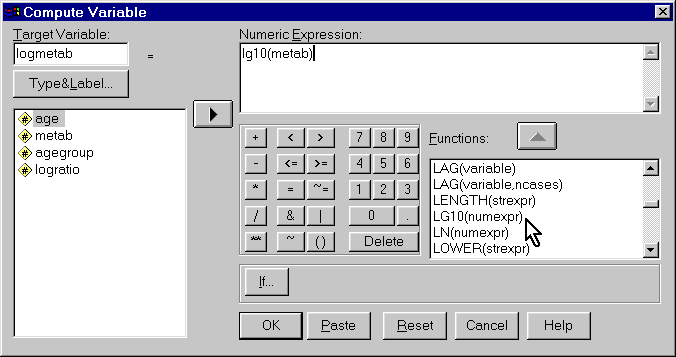
The first thing we need to do is to calculate the logarithm. In SPSS, we have two choices: a base 10 logarithm (lg10) or a natural logarithm (base e). Either one is fine, but you need to remember which one you choose.
To perform a log transformation, you select TRANSFORM | COMPUTE from the SPSS menu to get the following dialog box.
This is what the data looks like after computing the transformation:
Age Metab AgeGroup LogMetab
 14  17.1        1     1.23
 14   1.8        1     0.25
 14  25.5        1     1.41
 14   5.3        1     0.72
 14   1.9        1     0.27
 14   5.8        1     0.77
 14   7.9        1     0.89
 14   3.5        1     0.55
 14   5.6        1     0.75
 14   7.5        1     0.88
179   0.9        2    -0.04
179   2.2        2     0.35
181   0.8        2    -0.09
181   1.5        2     0.18
181   0.5        2    -0.33
181   1.4        2     0.15
182   1.1        2     0.02
182   1.0        2    -0.01
We calculate a two-sample t-test using the general linear model in SPSS. Here are the descriptive statistics that it reports.
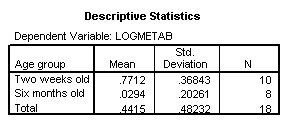
We can calculate the geometric means by computing 10 to the power of 0.7712 and 0.0294 respectively. Use the 10^x or y^x button found on most scientific calculators. This gives us geometric means of 5.90 and 1.07. If you had used a natural logarithm earlier, then you would use the e^x button to transform back to the original scale of measurement.
The table of parameter estimates below provides information for confidence intervals.
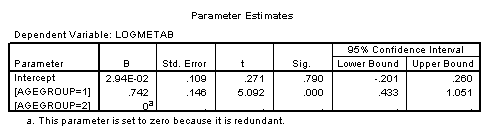
Notice that the estimate (the B column) for [AGEGROUP=1] represents the difference in mean logarithms (0.742 = 0.7712 - 0.0294). When we transform this estimate back to the original scale of measurement (5.52), we get a ratio of the two geometric means (note that 5.52=5.90/1.07).
It may seem strange that we get a ratio, but it makes sense. Remember in high school algebra that the difference between two logarithms was equal to the logarithm of the ratio? You can use that fact to show that the calculations above will always yield a ratio of geometric means.
We can also transform the confidence limits (0.433 to 1.051) back to the original scale of measurement. We get (2.71 to 11.2), which represents a 95% confidence interval for the ratio of geometric means. Thus we are reasonably confident that the six months old infants have a metabolism index that is more than twice as big and maybe up to ten times as big as the metabolism index for two week old infants.