[Previous issue] [Next issue]
Monthly Mean newsletter, February 2009
The monthly mean for February is 14.5. This is the lowest value in 24
months.
Welcome to the Monthly Mean newsletter for February 2009. This newsletter was sent out on February 23, 2009.
If you are having
trouble reading this newsletter in your email system, please go to
www.pmean.com/news/2009-02.html. If you are not yet subscribed to this
newsletter, you can sign on at
www.pmean.com/news. If you no longer wish to receive this newsletter, there is a link to unsubscribe at the bottom
of this email. Here's a list of topics.
- What IRBs should look for in a data safety and monitoring plan.
- A simple improvement to the binomial confidence interval.
- Is there a sample size too small to allow efficient randomization?
- Monthly Mean Article: The challenges faced in the design, conduct and
analysis of surgical RCTs.
- Monthly Mean Blog: The Ask Edward Tufte Forum.
- Monthly Mean Book: How to Report Statistics in Medicine.
- Monthly Mean Definition: What is a percentile?
- Monthly Mean Quote: If your experiment needs statistics,...
- Monthly Mean Website: Statistical Problems to Document and to Avoid
- Nick News: Nick the traveler, part 1.
- Very bad joke: Face it-I'm your statistically significant other.
- Tell me what you think.
1. What IRBs should look for in a data safety and monitoring plan.
The process that a data safety and monitoring board (DSMB) follows can
appear intimidating to the average researcher and to the average member of an
Institutional Review Board (IRB). It is indeed a complex process for a
committee to review an ongoing research study and make an intelligent
determination about whether the study should continue or if it should end
early. There is a complex dynamic involving the protection of the interest of
the individual research subjects in the study and the preservation of the
scientific integrity of the research protocol. If you are asked to review a
protocol that involves a DSMB, you shouldn't tinker with the details, but
there are some broad issues that you should feel free to comment on.
The first issue is whether a DSMB is needed at all. There is no hard and
fast rule about this. Granting agencies are becoming more likely to insist on
a DSMB for more of the research they are funding, and that is clearly a
mandate you can't ignore. In other situations, however, you should ask whether
a simpler structure may be more appropriate.
Perhaps the principal investigator, by himself/herself or in combination
with other members of the research team could serve the same function as the
DSMB. The protocol would then list specific situations where the PI would be
allowed to end the study early and situations where the PI would be forced to
end the study early. It would almost certainly be appropriate to add a
condition along the lines of "New information may emerge during the trial,
either from the trial data itself or from newly published research relating to
the medical condition being studied. If this information, in the opinion of
the PI, adversely affect the cost/benefit balance for patients entering the
study, then the study should stop enrolling patients." Nothing in this
statement, of course, would prevent or discourage an IRB from ending a study
if it saw evidence during the continuing review of a study that adversely
upset the cost/benefit balance.
Demand an independent DSMB if the PI has a financial stake in the
results of the study. Almost all phase III studies conducted by
Pharmaceutical firms use a DSMB for this reason. A DSMB is also called for if
the design of the research study is very complex, such as the use of multiple
sites. Finally DSMBs are needed when the stakes are high, such as in treating
a life threatening disease.
If the IRB determines that a DSMB is needed, then they should insist that
the DSMB must develop guidelines for early stopping prior to data
collection. The guidelines, however, should be sufficiently flexible to
allow the DSMB to take action in the event of unexpected findings during the
conduct of the study. You always need an escape clause if a drug to prevent
hair loss suddenly turns every patient into a werewolf, even if there was no
reason to suspect lycanthropy as a side effect at the start of the study.
Still, the DSMB should spell out as much as possible in advance.
Any decision to end a study early should explain how this affects
patients in the middle of the study. In some studies, stopping early also
means stopping the therapy of any currently enrolled patients in midstream. In
other studies this is the worst thing you could do and a a phased ending of
the therapy might be needed. Possibly, the only change would involve patients
getting the placebo being notified of their status with the recommendation
that they switch to the active therapy. Sometimes nothing should be done until
the currently enrolled patients complete all of their evaluations.
The IRB should ask how patients who have completed the trial should be
notified if a study is stopped early for safety reasons. These patients
are no longer at risk because they have stopped taking the therapy required in
the research study, but the simple principle of respect would demand that they
be kept informed of any issues serious enough to cause the study to stop
early. Notification to these patients might include recommendations about
additional tests or health monitoring.
Insist that standards for stopping early for safety reasons not be held
to as high a statistical standard as stopping early for efficacy reasons.
There is an extensive literature on the chances for declaring a false positive
result when you evaluate the data at multiple time points. I myself show some
simple results along these lines at my old website.
The statistical adjustments for these situations are complex, and the IRB
should not be expected to understand all the nuances of these methods. The IRB,
however, should make sure that safety issues are not held to the same rigorous
standard as early evidence of efficacy. The reason for this is that stopping
early for safety reasons does not raise the same issues about false positive
findings. This is not to say that stopping early for safety reasons should be
done without statistical rigor. Rather, it is just an acknowledgment that
safety is different. A DSMB, for example, should not mindlessly apply a
Bonferroni correction to multiple safety outcomes. A DSMB should examine
deviations in safety endpoints both with respect to the control group and with
respect to historical norms. While some efficacy endpoints can be evaluated
without breaking the blind, the DSMB should always have access to unblinded
safety data.
Finally, make sure that the people on your IRB responsible for
continuing review have access to any reports produced by the DSMB.
Information produced by the DSMB should be very helpful in deciding whether a
consent form needs to be modified or if the cost/benefit balance has been
altered. You should not rely solely on the DSMB, of course, but they will
provide you will lots of useful data. This may be a touchy point with some
researchers. A DSMB report showing a trial that is just on the verge of
stopping could, if made public, dry up the patient pool just a few weeks or
months before declaring victory. Although some people have advocated that
patients enrolling in a
trial cannot have truly informed consent without having access to all the data
collected up to that point, such disclosure can cause serious trouble with
the research. Thus, the IRB should respect the confidentiality of the DSMB
report.
2. A simple improvement to the binomial confidence interval.
The traditional formula for a confidence interval for a proportion fails to
work well when the sample proportion is very close to zero or very close to
one. I won't show the formula here, but the traditional formula involves
adding and subtracting a certain amount from the sample proportion. Adding and
subtracting the same amount makes the interval symmetric. The figure below
illustrates these intervals.
This figure shows what a traditional confidence interval would look like
when you observed 0 events out of 20, 1 event out of 20, etc. Notice that for
extreme proportions such as 1/20 and 19/20, the confidence limit extends well
outside the permissible range for a probability. Symmetry is not a good
property to have. The traditional interval has additional issues at the most
extreme cases (0/20 and 20/20). There the interval has zero width, which we
know is not correct. There are some adaptations that work better than the
traditional confidence interval. The Wilson interval, for example, is shown
below.
Again, I won't show the formula here, but notice that the interval is
highly asymmetric for proportions close to zero or close to 1. For the cases
0/20 and 20/20, the interval is as asymmetric as you can get with the sample
proportion sitting right on top of one of the confidence limits. If you're
someone who likes staring out formulas, you will notice that at a 95%
confidence level, the formula for the Wilson interval is not too much
different than the traditional interval with 2 added to the numerator of the
sample proportion and 4 added to the denominator. If you're someone who
doesn't like staring at formulas, just trust me on this. The graph below shows
how the approximation looks.
It's not perfect. The extreme cases of 0/20 and 20/20 still extend too far
outside the permissible range for probabilities, but at least this
approximation provides an interval with width greater than 0. Adding 2 and 4
to the numerator and denominator effectively pushes the interval inward. It
creates an asymmetry where the limit closer to 0 or 1 is shrunk and the limit
closer to the middle is expanded. For proportions that are not extremely close
to 0 or 1, the net effect of adding 2 and 4 to the numerator and denominator
is small.
There are many ad hoc rules about how to handle extreme proportions, such
as adding/subtracting 0.5/n. The nice thing about adding 2 and 4 to the
numerator and denominator is that it is easy to do and it draws support from a
theoretical perspective.
If you want to see the formulas, there is a
Wikipedia article
on the binomial proportion confidence interval that I myself
made some contributions to.
3. Is there a sample size too small to allow efficient randomization?
Randomization is the process of selecting the therapy that a patient
receives in a clinical trial using a random device like a flip of a coin, a
roll of a die, or (most frequently) a random number generator on a computer.
Randomization helps assure that the both therapies in a clinical trial get
roughly the same mix of good prognosis and poor prognosis patients. It relies
on the law of large numbers. But what's large? Louis Hsu tackled this problem
in a study published in 1989.
Hsu LM. Random sampling, randomization, and equivalence of contrasted
groups in psychotherapy outcome research. J Consult Clin Psychol.
1989;57(1):131-7.
He considered cases where there were one, two, or three potential binary
confounding variables and considered randomization to be a failure if the
proportions for any confounding variable was twice as large in one group as in
the other. As expected, with small sample sizes, the chances are good that you
would still have a large imbalance in a potential confounding variable. If,
however, you have 40 observations per group, then even with three potential
confounding variables, there is only a small probability of finding a large
imbalance in one of these potential confounders. If the number of potential
confounders is small, then perhaps a sample size of 20 observations per group
would be acceptable.
What do you do if you're randomizing, and you only have 10 observations per
group? You should consider matching or stratification of the randomized
sample. An interesting and underutilized alternative to randomization is
minimization.
Treasure T, MacRae KD. Minimisation: the platinum standard for trials? BMJ.
1998;317(7155):362-363. Available at:
http://www.bmj.com/cgi/content/full/317/7155/362 [Accessed February 18,
2009].
Some further discussions on various options for randomized studies appears
in
Hedden S, Woolson R, Malcolm R. Randomization in substance abuse clinical
trials. Substance Abuse Treatment, Prevention, and Policy. 2006;1(1):6.
Available at:
http://www.substanceabusepolicy.com/content/1/1/6 [Accessed February 18,
2009].
4. Monthly Mean Article: The challenges faced in the design, conduct and
analysis of surgical RCTs
Cook J. The challenges faced in the design, conduct and analysis of surgical
RCTs . Trials. 2009;10(1):9. Available at:
http://www.trialsjournal.com/content/10/1/9
[Accessed February 10, 2009]. Description: Randomization is difficult in any
study, but it is especially difficult in surgical trials. One issue is the
timing of the randomization. You need to allow surgeons enough lead time to
develop expertise with a new surgical trial, but during the time that this
expertise is being developed, sufficient observational data may appear that
would upset the balance of equipoise that is required by new trials.
Furthermore, side effects and complications that do occur if randomization is
done early may just reflect a lack of experience with a new type of surgery.
Surgical trials also have difficulty attracting funding, compared to
pharmaceutical interventions. There is a lot of money to be made marketing a new
drug, and this potential for profit will attract a lot of investment money.
Because surgical interventions cannot be bottled and shelved, there is no profit
forces working to promote their use. Surgical trials, therefore, require a
greater degree of government funding. Patient preferences may make randomization
difficult when the comparison is between a surgical and non-surgical
intervention. It is hard to find patients who are indifferent to surgery: either
they want it really badly to get the problem fixed quickly, or they are scared
of surgery and would prefer less invasive approaches. An added complication
occurs because the doctor who performs the surgery is usually not the same
doctor as the one who provides the non-surgical intervention. This adds
heterogeneity to the process. Finally, blinding, a process that is relatively
easy for many drug comparisons, is usually troublesome in surgical
interventions. Unless the two surgical interventions are very similar, patients
will usually know by the size and/or location of the scar which surgical
technique was done. This article does suggest some recent innovations in
clinical trial design that can help, but many of these issues will continue to
cause problems for future randomized trials of surgical interventions.
5. Monthly Mean Blog:
The Ask Edward Tufte Forum,
Edward Tufte.
This is actually an RSS feed rather than a blog, but that's nitpicking.
Edward Tufte is a prominent spokesperson for good graphic design. In this blog
he takes reader questions and provides an answer and sometimes lets other
reader chip in with their advice. There's a lot of interesting abstract
discussion about aesthetic ideas, but also some very pragmatic advice. Some of
the more interesting recent threads include
6. Monthly Mean Book: How to report statistics in medicine, Lang TA, Secic
M.
This is the perfect book for anyone who is uncertain of how to properly
describe the statistical results in a research paper. There is a series of
recommendations with sample wording ("When reporting percentages, always give
the numerators and the denominators of the calculations"). Many sections include
an example of how you would specifically word something ("Of 1000 men with heart
disease, 800 (80%) had high serum cholesterol levels; of the 800, 250 (31%) were
sedentary"). The advice is both sound and easy to follow. There are chapters on
- Reporting numbers and descriptive statistics
- Reporting measures of risk
- Reporting estimates and confidence intervals.
- Reporting hypothesis tests
- The multiple testing problem
- Reporting association and correlation analysis
- Reporting regression analysis
- Reporting analysis of variance (ANOVA)
- Reporting survival analysis
- Reporting the performance characteristics of diagnostic tests
- Reporting Bayesian statistical analysis
- Reporting Epidemiological Measures
- Reporting randomized controlled trials
- Reporting cohort or longitudinal studies
- Reporting case-control studies
- Reporting surveys or cross-sectional studies
- Reporting systematic reviews and meta-analyses
- Reporting economic evaluations
- Reporting decision analyses and clinical practice guidelines
- Reporting values, groups, and comparisons in tables
- Reporting values, groups, and comparisons in figures
This is probably the book that I have recommended to people more than any
other. There is a nice review of this book at
http://ebm.bmj.com/cgi/content/full/12/3/90.
7. Monthly Mean Definition: What is a percentile?
The pth percentile of a data set is a value so that roughly p% of the data
is smaller and (100-p)% of the data is larger. [[Note: the original newsletter
had a typo here and incorrectly used the word "smaller" rather than
"larger".]] Certainly commonly used
percentiles have special names. The 50th percentile is commonly called the
median. The quartiles of a data set represent the 25th, 50th, and 75th
percentiles. The deciles of a data set represent the 10th, 20th, 30th, etc.
percentiles. It should not be too hard to guess what the quintiles are. A bit
more obscure are the tertiles, which are the values that split the data into
three equal groups. Depending on what kind of nitpicker you are, the tertiles
are the 33rd and 67th percentiles, maybe the 33.3 and 66.7 percentiles, or
possibly even the 33 1/3 and 66 2/3 percentiles.
There several subtle issues in the definition of a percentile. First, some
people insist that a percentile only makes sense if p is a whole number. These
people would argue that there is a first percentile (1%) and a second
percentile (2%) but not a 1.5 percentile. Second, if you express p as a
proportion rather than a percent, then you need to use the term "quantile".
Thus the 25th percentile and the 0.25 quantile are the same thing. But if you
asked for the 0.25 percentile, you would either be out of order because 0.25
is not a whole number, or you would be asking for a value so that 0.25% (that
is, 0.0025) of the data is smaller. I'm not as nitpicky as most people on
this, but it always helps to use these terms precisely.
Often, researchers will define groups in terms of their percentiles. For
example, in a study of ascorbic acid, the following result was
noted in the
abstract:
While diastolic blood pressure among persons in the lowest quartile of
plasma ascorbic acid increased by 5.97 mmHg (95% CI 3.82 to 8.13 mmHg) from
year 9 to year 10, those in the highest quartile of plasma vitamin C increased
by only 0.23 mmHg (95% CI -1.90 to +2.36 mmHg)
Here the term "lowest quartile" means those patients whose plasma ascorbic
acid was at or below the 25th percentile.
Finally, there is not a consensus in the research community on how to best
calculate a percentile from a set of data. If your data set has 6
observations, there is no value that has exactly 25% of the data smaller than
it. That's why I used the word "roughly" in my definition. A
wikipedia article on
percentiles offers a range of mathematical definitions. I prefer a simple
definition. If you want to compute the pth percentile of a set of n values,
compute p*(n+1)/100. If this value is a whole number choose that value from
the data set ordered from smallest to largest. If it is a fractional value,
round up and round down and choose the point halfway between the two rounded
values. Thus for a set of 6 numbers, the 25th percentile is halfway between
the first and second values in the ordered data set because p(n+1)/100 = 1.75.
For a set of 7 numbers, the 25th percentile is the second value in the ordered
data set because p(n+1)/100=2.
There are two nitpicky cases that still need to be mentioned with my
formula. If p(n+1)/100 is less than 1, choose the smallest value and if it is
greater than n, choose the largest value.
That seems messy, but some people advocate something even more complex. In
the first situation listed above, where p(n+1)/100 is 1.75, they would not go
halfway between the first and second number but rather 75% of the way towards
the second number. So if the smallest value is 2 and the second smallest value
is 6, make the 25th percentile 5 rather than 4. This is known linear
interpolation. It might provide slightly better results, but life is too short
to make all these extra calculations.
8. Monthly Mean Quote
If your experiment needs statistics, you ought to have done a better
experiment. Ernest Rutherford, quoted at
http://www.brainyquote.com/quotes/quotes/e/ernestruth391627.html.
I disagree with this advice, of course, but it is too humorous not to mention.
9. Monthly Mean Website:
Statistical Problems to Document and to Avoid,
Frank Harrell
Most statisticians, including me, would benefit if we listened more carefully
to the advice of Frank Harrell. He summarizes some important issues about
statistical analysis in a checklist, Statistical Problems to Document and to
Avoid. He mentions inefficiencies associated with categorizing continuous
variables, inappropriate use of means and standard deviations for summarizing
highly skewed data, failure to include confidence intervals, and problems
associated with stepwise regression and overfitting. URL: http://biostat.mc.vanderbilt.edu/twiki/bin/view/Main/ManuscriptChecklist
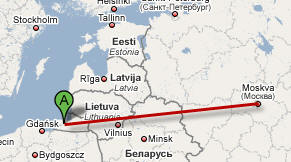
10. Nick News: Nick the traveler, part 1.
Nicholas has always been a very good traveler. He was adopted from Russia,
so as a two year old, he got to experience a lot more traveling than many
adults. His first flight, from Kaliningrad to Moscow, went very smoothly.
Here's a picture of him on the airplane. He amused himself during the
flight with an apple and a plastic knife and carved an elaborate apple
structure.

Go to
www.pmean.com/personal/traveler.html to see our favorite picture of the
new family in front of St. Basil's cathedral and read about the long flight
from Moscow to Kansas City.
11. Very bad joke: Face it-I'm your statistically significant other.
The comic xkcd is written by a true geek (and I use this word in a
complimentary fashion). Someone on the EDSTAT-L internet mail discussion group
noted the following comic, which is probably the first and only comic to
include a boxplot.
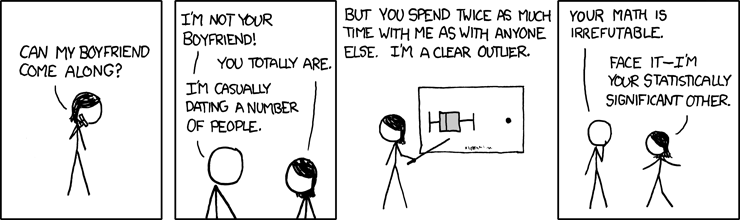
I can include this comic strip directly in this newsletter, because the author (Randall
Munroe) has a very liberal usage policy.
I am very grateful to people on the web who make it easy to share their work. The main site for this comic strip is
www.xkcd.com and the permanent link to this particular comic is
http://xkcd.com/539/.
12. Tell me what you think.
How did you like this newsletter? I have
three short open ended questions
that I'd like to ask. It's totally optional on your part. Your responses will
be kept anonymous, and will only be used to help improve future versions of
this newsletter. You can also provide feedback by replying to this message.
Unlike most newsletters where a reply goes into a black hole, a reply to this
newsletter will go straight back to me.
January's newsletter produced three comments on the web survey and two
emails.
Someone was nice enough to point out a broken link in the January
newsletter. When I link to my own website, iContact gets confused, so I need
to manually insert the proper URLs for these links. I forgot one, which was a
plug for my book. The correct link is
http://www.pmean.com/Evidence.html. The same person also pointed out that
when adults fall, it's not only the greater mass, but also the greater
velocity due to the fact that we are up higher than kids. Greater mass and
greater velocity is a double whammy. Cathy's pretty much recovered from the
skating experience, by the way.
I got a compliment for my section on crude versus adjusted comparisons. I
was worried that it was a bit too technical. That person also wanted to see a
discussion of generalized estimating equations in a future newsletter. I'm not
sure I understand GEE models well enough to explain them clearly, but I will
try to place them in the general context of repeated measures designs as a
starting point. It may take a while for me to get something coherent written
about this. This person also thought that "Nick News" was cute. Thanks!
Two people emphasized a desire for basic statistics, how-to tutorials, and
general concepts. That's my general goal. I'm not writing for people who
already know Statistics inside and out.
I also got a nice email from someone who liked my description of CART and
the reference on overlapping confidence intervals. This person suggested some
material on Bayesian models (more specifically, the Bayes factor). I had just
come back from a conference on Bayesian Biostatistics, so the material is
fresh in my mind. The hard part will be trying to make it accessible.
What now?
Sign up for the Monthly Mean newsletter
Review the archive of Monthly Mean newsletters
Go to the main page of the P.Mean website
Get help
 This work is licensed under a
Creative
Commons Attribution 3.0 United States License. This page was written by
Steve Simon and was last modified on
2017-06-15. Need more
information? I have a page with general help
resources. You can also browse for pages similar to this one at
Category: Website details.
This work is licensed under a
Creative
Commons Attribution 3.0 United States License. This page was written by
Steve Simon and was last modified on
2017-06-15. Need more
information? I have a page with general help
resources. You can also browse for pages similar to this one at
Category: Website details.